Guide
Liquidation heatmap vs order book heatmap
Liquidation heatmaps and order book heatmaps look alike: bright horizontal bands on a Bitcoin price chart. They are built from completely different things. An order book heatmap shows limit orders that are actually resting on an exchange. A liquidation heatmap shows where a model estimates that leveraged positions would be force-closed. Knowing which is which changes how much weight a band deserves.
What a liquidation is
Traders on perpetual futures can borrow to hold a position larger than their margin. If price moves far enough against them, the exchange closes the position for them: a liquidation. On Binance the liquidation engine closes it with an order that trades immediately, so a liquidation shows up as aggressive buying (a short being closed) or aggressive selling (a long being closed). Many at once can push price through several levels in seconds, which can trigger the next ones.
How a liquidation heatmap is made
No exchange publishes who holds which position at which leverage. Binance's public liquidation stream shows at most one liquidation order per second per contract, as a sample. So liquidation heatmaps are models. A typical recipe:
- Look at where open interest rose, as an estimate of where new positions were opened.
- Assume a mix of leverage, for example 10×, 25×, 50× and 100×.
- Work out the liquidation price each would have, and add the estimates up into bands.
Each step is an assumption: some positions are closed or topped up with margin, some are hedged elsewhere, and the leverage mix is a guess. The bands can be useful as a picture of where forced flow might appear, but they are not observations.
How an order book heatmap is made
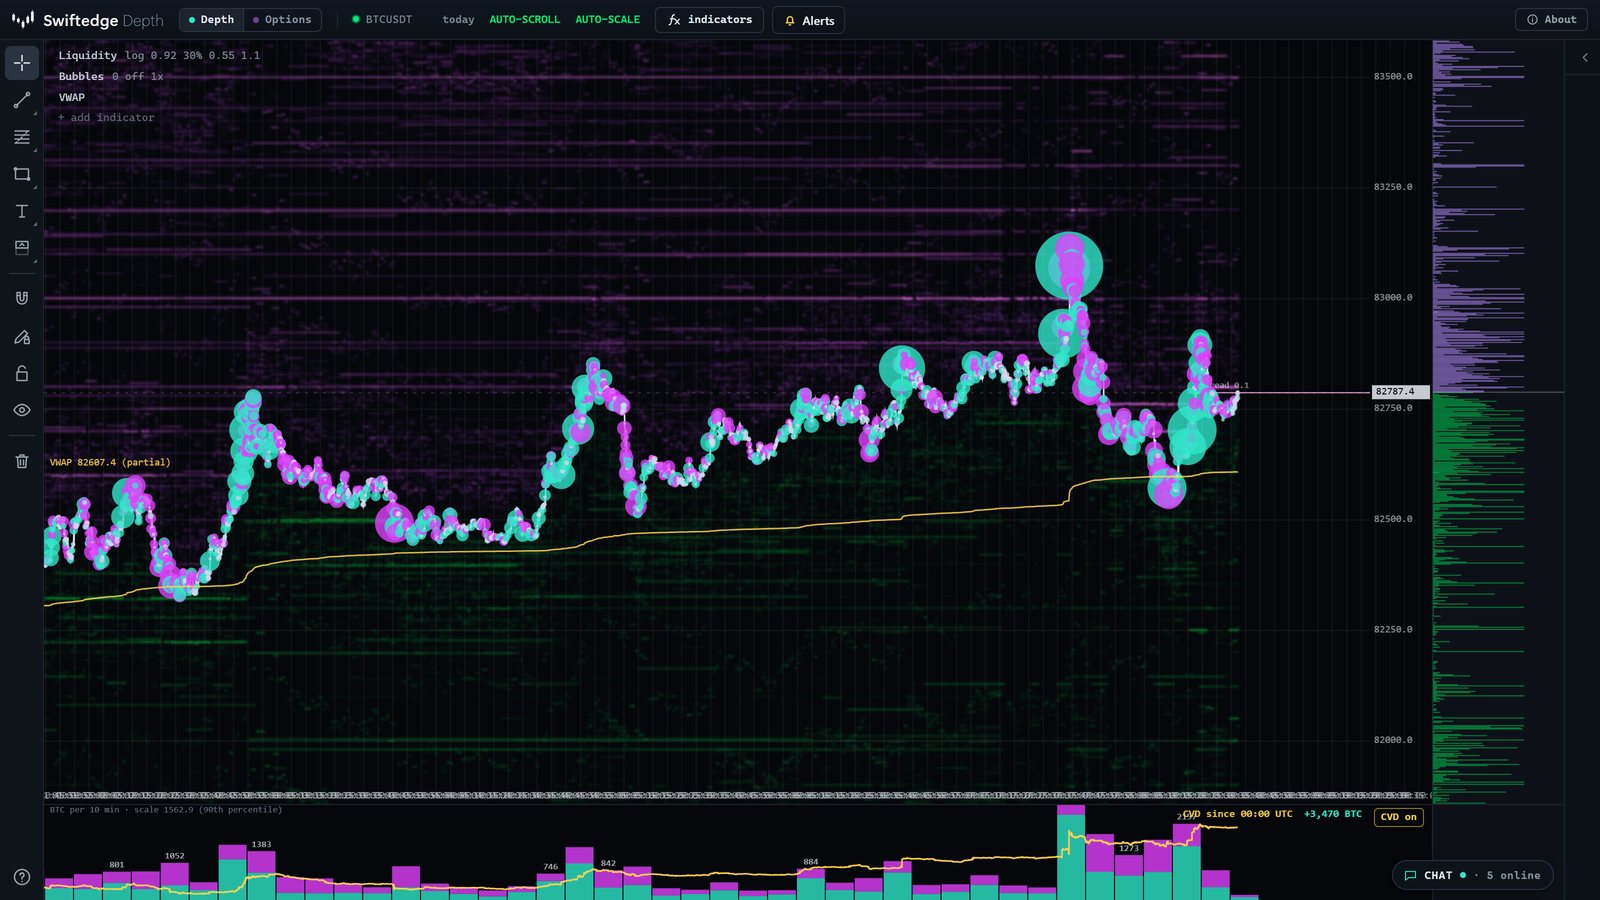
An order book heatmap records the actual order book over time. Swiftedge Depth takes the Binance BTCUSDT perpetual book four times a second, out to about 2 % from price, and colours every price by how much is resting there: green bids below, violet asks above. Trades are drawn on top as bubbles. Every band was really there, and you could have traded against it while it lasted.
Side by side
| Order book heatmap (Swiftedge Depth) | Liquidation heatmap | |
|---|---|---|
| What a band is | Resting limit orders that are in the book | Prices where leveraged positions are estimated to be force-closed |
| Source | The exchange's order book, recorded four times a second | A model: open interest, price history and an assumed mix of leverage |
| Observed or estimated | Observed | Estimated: exchanges do not publish anyone's positions or leverage |
| Can you trade against it now? | Yes, until it is cancelled or filled | No: nothing is in the book until a liquidation is triggered |
| How it ends | Held, eaten by trades, or pulled | The position is closed, reduced or topped up, which the map cannot see |
What our data shows about bright bands
- Resting walls often leave before price arrives. In four weeks of our own recordings, 92 % of the large walls that disappeared while more than 75 USD from price were cancelled, not traded. The spoofing guide has the full numbers.
- No reliable magnet. We tested whether price is drawn toward the thickest resting liquidity in the book (85 hours of our recordings, August 2026). Compared with other levels at the same distance, the thickest bands showed no consistent pull: small effects in one setup disappeared in another and changed sign between the first and second half of the data.
- Different time scales. The thickest resting size usually sits 100 to 250 USD or more from price, while a typical five-minute Bitcoin move in that test was about 30 USD (90 % of them under about 130 USD).
How to use the two. A liquidation map is a model of where forced orders might appear. An order book heatmap shows what is in the book now and whether it holds. Neither says where price will go.
See the real order book.Swiftedge Depth shows the live Bitcoin futures order book as a heatmap with every trade, four times a second. Free, no sign-up.
Open Swiftedge DepthCommon questions
Does Swiftedge have a liquidation heatmap?
Yes, as a separate page: the Bitcoin liquidation heatmap (and the Ethereum version) estimates liquidation levels from open interest and shows how well they lined up with real liquidations. Swiftedge Depth itself shows the real order book, not estimates.
Are liquidation levels real orders?
No. They are estimates of where positions would be force-closed. Nothing sits in the order book at those prices until a liquidation is actually triggered.
Does price get pulled toward big liquidity?
In our own test on resting order book liquidity, price was not reliably drawn toward the thickest bands once their distance from price was taken into account. We have not tested third-party liquidation maps, because their underlying data is not public.
Can I see liquidations in Swiftedge Depth?
Yes. Add the Liquidations indicator in Depth to mark real liquidations from Binance, OKX and Bybit on the chart. They are also listed on Bitcoin liquidations today.