Community scripts › Authors
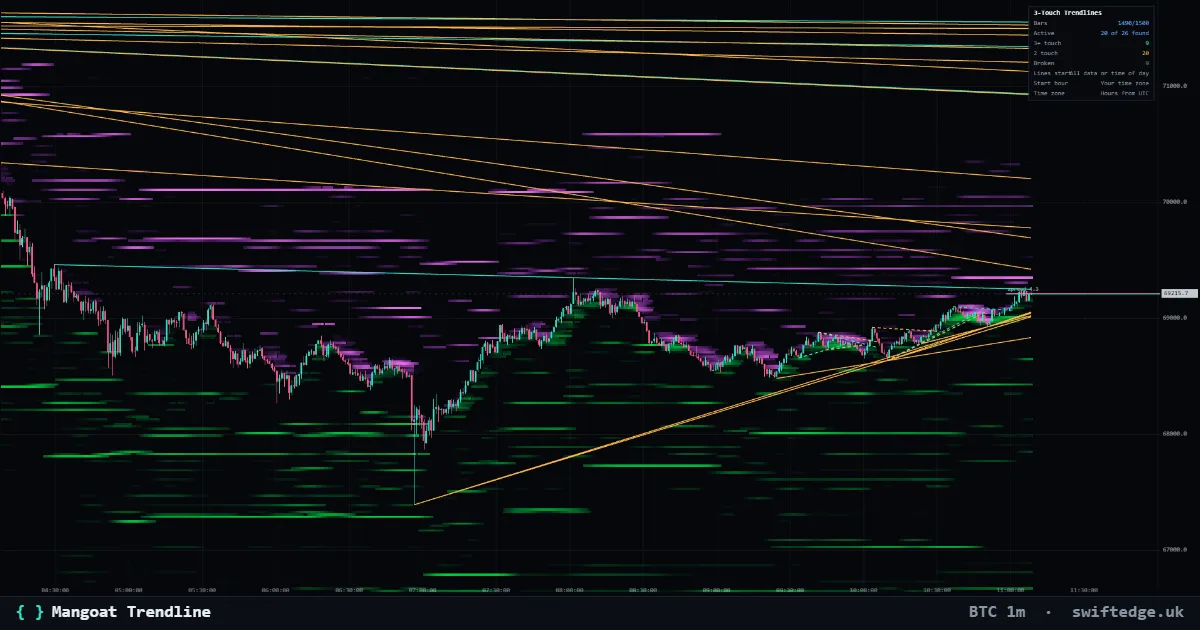
Draws trendlines through swing highs (sell side) and swing lows (buy side) that have at least 3 touch points. Every touch is marked T1, T2, T3 and so on. Lines that are still intact run to the live bar and are solid. Lines that price has already closed through stop at the break and are dashed.
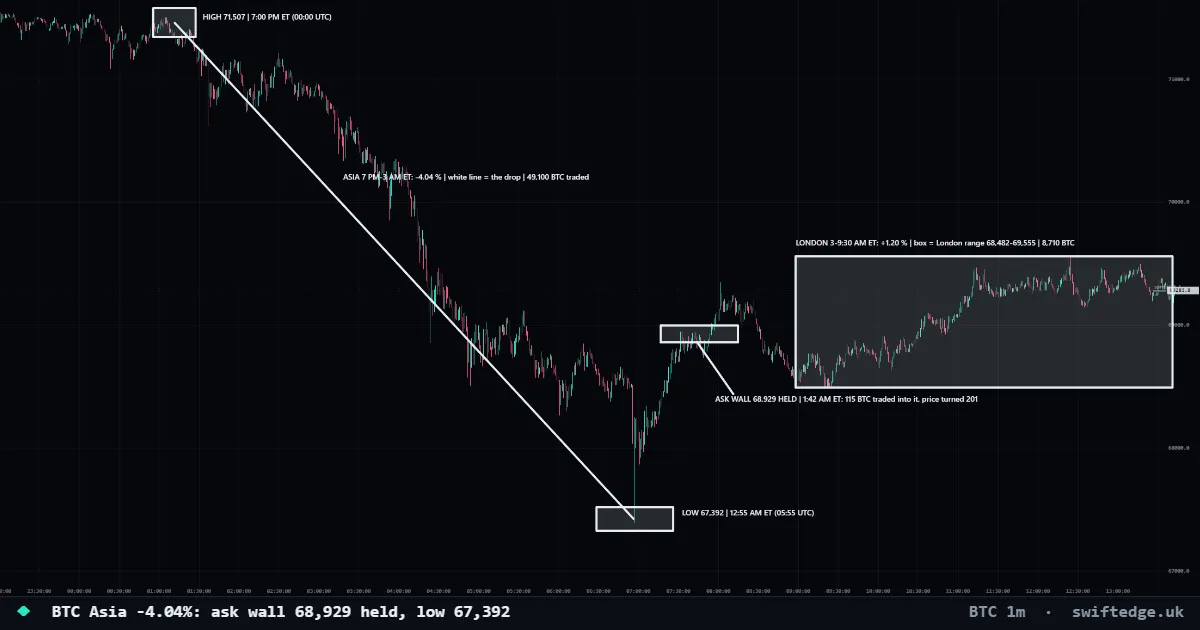
What I see: HOW TO READ THE CHART. Everything drawn in white is explained by its own label. The white line is the Asia drop. The top-left box is the high, the bottom box is the low, the small box is the ask wall that hel