BTC Asia -4.04%: ask wall 68,929 held, low 67,392
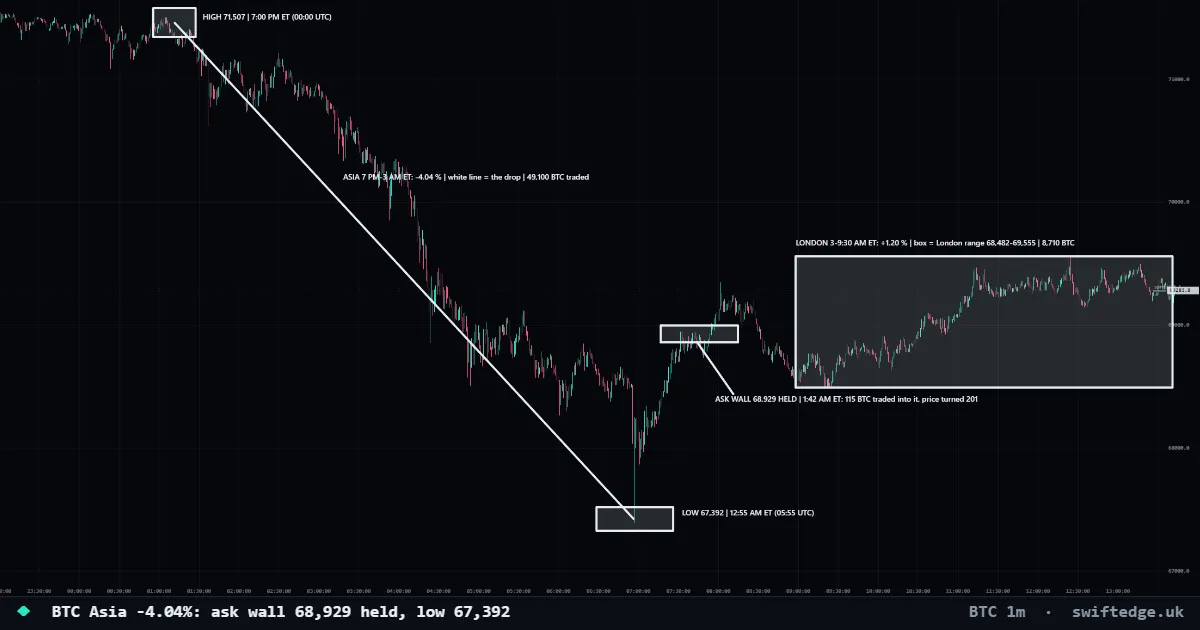
What I see: HOW TO READ THE CHART. Everything drawn in white is explained by its own label. The white line is the Asia drop. The top-left box is the high, the bottom box is the low, the small box is the ask wall that held, and the large box is the London session range.
THE MOVE. Asia (7 PM-3 AM ET) took BTC from the 71,507 high at 7:00 PM ET (00:00 UTC) down to a 67,392 low at 12:55 AM ET (05:55 UTC): -4.04 %, a range of 4,115 on 49,100 BTC traded.
THE WALL. At 1:42 AM ET (06:42 UTC) an ask wall at 68,929 held: 115 BTC traded into it and price turned 201 away. That is the small box on the way back up from the low.
LONDON. London (3:00-9:30 AM ET) is +1.20 %, range 68,482-69,555 on 8,710 BTC (the large box). A second ask wall at 68,841 held at 3:48 AM ET (08:48 UTC): about 20 BTC traded into it, price turned 96.
CONTEXT. Funding is +0.0100 % per 8 hours (longs pay shorts). Open interest is about 40,900 BTC, down 2.9 % in 24 hours. The low printed on a long lower wick, so the move down was fast and the recovery started the same hour.
Levels I watch: Asks (resting sell liquidity): 70,050 (285 BTC), 69,825 (193 BTC), 69,775 (183 BTC).
Bids (resting buy liquidity): 68,875 (245 BTC), 69,325 (225 BTC), 68,625 (204 BTC).
Reference prices: 71,507 high, 69,000 round level, 68,929 held ask wall, 68,841 held ask wall, 67,392 low.
What would change my mind: A trade through the 70,050 ask wall with most of it eaten would change this read. So would a new low below 67,392. Walls that vanish within seconds with almost nothing traded (pulled) are not the same as walls that hold, so the levels are only as good as the order book that stands behind them.