Community scripts › Mangoat Trendline
What it does
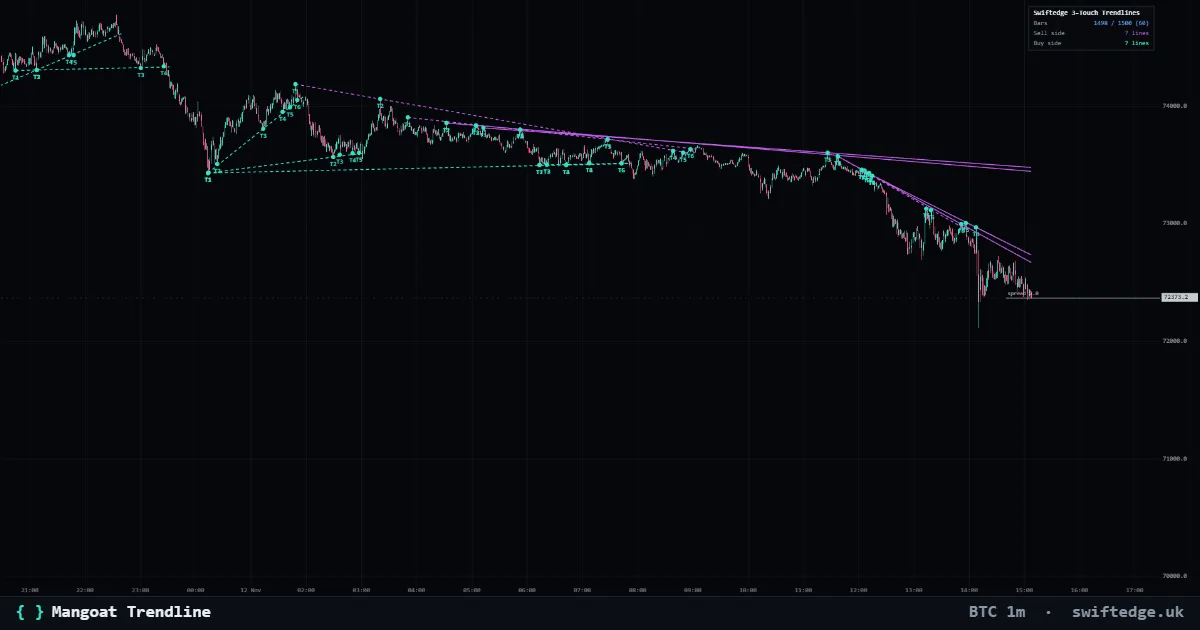
Draws trendlines through swing highs (sell side) and swing lows (buy side) that have at least 3 touch points. Every touch is marked T1, T2, T3 and so on. Lines that are still intact run to the live bar and are solid. Lines that price has already closed through stop at the break and are dashed.
How it works
It finds swing highs and lows on the chart’s own candles, tries lines between them and counts the swings that touch each line. A line is dropped when a candle body closes clearly through it. The touch tolerance and the wiggle room scale with ATR, so the same settings fit different markets and timeframes. Only the chart’s candles are used. Lines are fixed to closed candles and do not move on each live tick.
How to use it
Add it to any market and timeframe. Every setting is in the panel: minimum touch points, line length, swing sizes, touch precision, wiggle room, history bars, trend-only or any direction, and a switch for sell side and buy side. Zoom out and raise “History bars” to see older lines. Lower the minimum touch points to 2 to see more candidate lines.
What's original
Most trendline tools draw one line by hand or one automatic line. This one scans the whole chart in five overlapping windows, keeps the best lines from each, and shows every touch point. The wiggle room is ATR-based instead of exact price, so lines can allow small wick poke-outs.
Limitations
Trendlines depend on the swings chosen, so different settings give different lines. Very flat or thin markets can give few or no lines. Fast spikes can break a line at once. On very long charts the oldest part may be skipped to stay fast. Descriptive market data, not financial advice.
Source code
Open source under MPL-2.0. Copy it with credit: "Copy to my scripts" adds the credit for you.
// Mangoat 3-Touch Trendlines v10 (Swiftedge Script)
// Descriptive market data, not financial advice.
// v10: works the same on every market (Bitcoin to XRP, US 500, Gold, WTI):
//  - tolerance from a robust ATR (never collapses on quiet/flat bars)
//  - pivots accept equal highs/lows (tick-size markets), skip empty/flat bars
//  - skips missing values, work budget so it never hits the 2 s stop
script({ name: "mangoat 3-Touch Trendlines" });

const useAllData = input.bool(true, "Use all chart data");
const customBars = input.int(1500, "History bars (if not all)", { min: 100, max: 1500 });
const minTouches = input.int(3, "Min touch points", { min: 2, max: 8 });
const minLineSpan = input.int(14, "Min line length (bars)", { min: 6, max: 150 });
const touchSpacing = input.int(5, "Min bars between touches", { min: 2, max: 40 });
const smallPivot = input.int(3, "Small swing size (bars)", { min: 2, max: 10 });
const bigPivot = input.int(7, "Big swing size (bars)", { min: 3, max: 30 });
const touchPrecisionAtr = input.number(0.26, "Touch precision (ATR)", { step: 0.02 });
const wiggleAtr = input.number(0.48, "Line wiggle room (ATR)", { step: 0.05 });
const slopeMode = input.select("Trend only", "Line direction", ["Trend only", "Any"]);
const maxTotalLines = input.int(14, "Max lines (down + up)", { min: 2, max: 24 });
const showDownLines = input.bool(true, "Show sell side (highs)");
const showUpLines = input.bool(true, "Show buy side (lows)");
const showDots = input.bool(true, "Show touch points (T1..Tn)");

const nBars = bars.length;
const lastClosed = nBars - 2;
const ok = (v) => typeof v === "number" && Number.isFinite(v);

// ---------- Robust ATR: median of the window as a floor, so quiet hours or flat bars never shrink the tolerance to zero
const atrRaw = ta.atr(14);
const activeLookback = useAllData ? lastClosed : Math.min(lastClosed, customBars);
const startIdx = Math.max(bigPivot + 1, lastClosed - activeLookback);

function median(arr) {
  if (arr.length === 0) return NaN;
  const s = arr.slice().sort((a, b) => a - b);
  return s[Math.floor(s.length / 2)];
}
const atrVals = [];
for (let i = startIdx; i <= lastClosed; i++) if (ok(atrRaw[i]) && atrRaw[i] > 0) atrVals.push(atrRaw[i]);
const priceRef = ok(close[lastClosed]) ? Math.abs(close[lastClosed]) : 1;
const medAtr = ok(median(atrVals)) ? median(atrVals) : priceRef * 0.002;
const atrFloor = Math.max(medAtr * 0.5, priceRef * 0.00005);
const atrAt = (b) => (ok(atrRaw[b]) ? Math.max(atrRaw[b], atrFloor) : medAtr);

// A bar is usable when it has prices and actually moved (or traded)
const usable = (i) =>
  ok(high[i]) && ok(low[i]) && ok(open[i]) && ok(close[i]) &&
  (high[i] > low[i] || (ok(volume[i]) && volume[i] > 0));

// ---------- Work budget (inner loop steps), keeps every market under the 2 s limit
let budget = 6000000;
let budgetHit = false;

// ---------- Pivots: equal highs/lows count once (first bar of the run)
function getPivotsInRange(isHigh, fromIdx, toIdx) {
  const map = new Map();
  const sizes = [smallPivot, bigPivot];
  for (let s = 0; s < sizes.length; s++) {
    const len = sizes[s];
    const begin = Math.max(len, fromIdx);
    const end = Math.min(lastClosed - len, toIdx);
    for (let i = begin; i <= end; i++) {
      if (!usable(i) || map.has(i)) continue;
      const v = isHigh ? high[i] : low[i];
      let good = true;
      for (let k = 1; k <= len && good; k++) {
        const l = isHigh ? high[i - k] : low[i - k];
        const r = isHigh ? high[i + k] : low[i + k];
        if (ok(l)) {
          if (isHigh ? l > v : l < v) good = false;
          if (k === 1 && l === v) good = false; // not the first bar of an equal run
        }
        if (ok(r) && (isHigh ? r > v : r < v)) good = false;
      }
      if (good) map.set(i, { idx: i, price: v });
    }
  }
  return Array.from(map.values()).sort((a, b) => a.idx - b.idx);
}

function sampleEvenly(pivots, maxCount) {
  if (pivots.length <= maxCount) return pivots;
  const step = (pivots.length - 1) / (maxCount - 1);
  const out = [];
  for (let i = 0; i < maxCount; i++) out.push(pivots[Math.round(i * step)]);
  return out;
}

function scanWindow(pivots, isRes, spanMin, dotGap) {
  const found = [];
  const count = pivots.length;
  for (let i = 0; i < count - 1 && !budgetHit; i++) {
    const p1 = pivots[i];
    for (let j = i + 1; j < count; j++) {
      const p2 = pivots[j];
      if (p2.idx - p1.idx < dotGap) continue;
      const slope = (p2.price - p1.price) / (p2.idx - p1.idx);
      if (slopeMode === "Trend only") {
        if (isRes && slope > 0) continue;
        if (!isRes && slope < 0) continue;
      }

      const touches = [p1];
      let lastTouchIdx = p1.idx;
      let brokenAt = -1;
      let pierces = 0;

      for (let b = p1.idx + 1; b <= lastClosed; b++) {
        if (--budget <= 0) { budgetHit = true; break; }
        if (!usable(b)) continue;
        const linePrice = p1.price + slope * (b - p1.idx);
        const a = atrAt(b);
        const lineTol = a * wiggleAtr;
        const touchTol = a * touchPrecisionAtr;
        const bodyTop = Math.max(open[b], close[b]);
        const bodyBot = Math.min(open[b], close[b]);

        if (isRes && (bodyTop > linePrice + lineTol * 0.45 || high[b] > linePrice + lineTol * 1.35)) { brokenAt = b; break; }
        if (!isRes && (bodyBot < linePrice - lineTol * 0.45 || low[b] < linePrice - lineTol * 1.35)) { brokenAt = b; break; }
        if (isRes ? high[b] > linePrice : low[b] < linePrice) pierces++;

        if (b < p1.idx + dotGap) continue;
        const v = isRes ? high[b] : low[b];
        const prev = isRes ? high[b - 1] : low[b - 1];
        const next = isRes ? high[b + 1] : low[b + 1];
        const isTurn = isRes
          ? (!ok(prev) || v >= prev) && (!ok(next) || v >= next)
          : (!ok(prev) || v <= prev) && (!ok(next) || v <= next);
        if (!isTurn || Math.abs(v - linePrice) > touchTol) continue;
        if (b - lastTouchIdx >= dotGap) {
          touches.push({ idx: b, price: v });
          lastTouchIdx = b;
        } else if (isRes ? v > touches[touches.length - 1].price : v < touches[touches.length - 1].price) {
          touches[touches.length - 1] = { idx: b, price: v };
          lastTouchIdx = b;
        }
      }
      if (budgetHit) break;

      if (touches.length < minTouches) continue;
      if (brokenAt !== -1 && brokenAt <= lastTouchIdx) continue;
      const span = lastTouchIdx - p1.idx;
      if (span < spanMin) continue;

      const isActive = brokenAt === -1;
      const score = touches.length * 5000 + span * 25 + (isActive ? 9000 : 0) - pierces * 150;
      found.push({ p1, lastTouchIdx, touches, slope, isRes, brokenAt, isActive, score });
    }
  }
  found.sort((a, b) => b.score - a.score);
  return found;
}

function buildSide(isRes, sideLimit) {
  const totalSpan = lastClosed - startIdx;
  if (totalSpan < 25) return [];
  const slices = 5;
  const step = Math.floor(totalSpan / slices);
  const windowWidth = Math.floor(step * 1.75);
  const picked = [];

  // newest window first, so the budget always covers the bars next to price
  for (let w = slices - 1; w >= 0 && !budgetHit; w--) {
    const wStart = startIdx + w * step;
    const wEnd = w === slices - 1 ? lastClosed : Math.min(lastClosed, wStart + windowWidth);
    const last = w === slices - 1;
    const spanMin = last ? Math.max(8, Math.floor(minLineSpan * 0.6)) : minLineSpan;
    const dotGap = last ? Math.max(2, Math.floor(touchSpacing * 0.7)) : touchSpacing;

    const pivots = sampleEvenly(getPivotsInRange(isRes, wStart, wEnd), 45);
    const cands = scanWindow(pivots, isRes, spanMin, dotGap);

    let added = 0;
    for (const c of cands) {
      const dup = picked.some(
        (p) => Math.abs(p.p1.idx - c.p1.idx) < 25 && Math.abs(p.lastTouchIdx - c.lastTouchIdx) < 25
      );
      if (!dup) { picked.push(c); added++; }
      if (added >= 2) break;
    }
  }
  picked.sort((a, b) => b.score - a.score);
  return picked.slice(0, sideLimit);
}

const perSide = Math.max(1, Math.floor(maxTotalLines / 2));
const downLines = lastClosed > 30 && showDownLines ? buildSide(true, perSide) : [];
const upLines = lastClosed > 30 && showUpLines ? buildSide(false, perSide) : [];
const allLines = [...downLines, ...upLines];

allLines.forEach((line, idx) => {
  const series = new Array(nBars).fill(null);
  const drawEnd = line.isActive ? nBars - 1 : Math.min(nBars - 1, line.brokenAt + 3);
  for (let b = line.p1.idx; b <= drawEnd; b++) series[b] = line.p1.price + line.slope * (b - line.p1.idx);

  const dir = line.isRes ? "Sell side" : "Buy side";
  plot.line(`${dir} #${idx + 1} (${line.touches.length}T)`, series, {
    tone: line.isRes ? "ask" : "bid",
    style: line.isActive ? "solid" : "dashed"
  });
  if (showDots) {
    line.touches.forEach((t, k) => plot.marker(t.idx, t.price, { shape: "dot", label: `T${k + 1}` }));
  }
});

const rows = [
  ["Bars", `${activeLookback} / ${nBars} (${market.timeframe || "chart"})`, "accent"],
  ["Sell side", `${downLines.length} lines`, "ask"],
  ["Buy side", `${upLines.length} lines`, "bid"]
];
if (budgetHit) rows.push(["Note", "Large chart: oldest part skipped, lower history bars", "warn"]);
if (allLines.length === 0) rows.push(["Note", "No lines: try Min touch points 2 or more wiggle room", "warn"]);
plot.info(rows, { title: "Swiftedge 3-Touch Trendlines" });