Community scripts › Built into Depth › Liquidation Map
What it shows
The real liquidation prices of the scanned positions as a profile at the price axis, the biggest clusters with their size and distance, and whales and top 50 traders at their own liquidation price.
How to read it
Part of Swiftedge Plus: it runs in Depth on the real trades and order book, with its own settings. Members turn it on under Indicators; the guide explains every setting.
Settings in Depth
| Range around price | ±5% |
| Profile width | normal |
| Brighter part = 20x leverage or more | on |
| Faint bands across the chart at the biggest clusters | on |
| Price, size and distance on the biggest clusters | on |
| Whales and top 50 traders at their liquidation price | on |
More in Swiftedge Plus
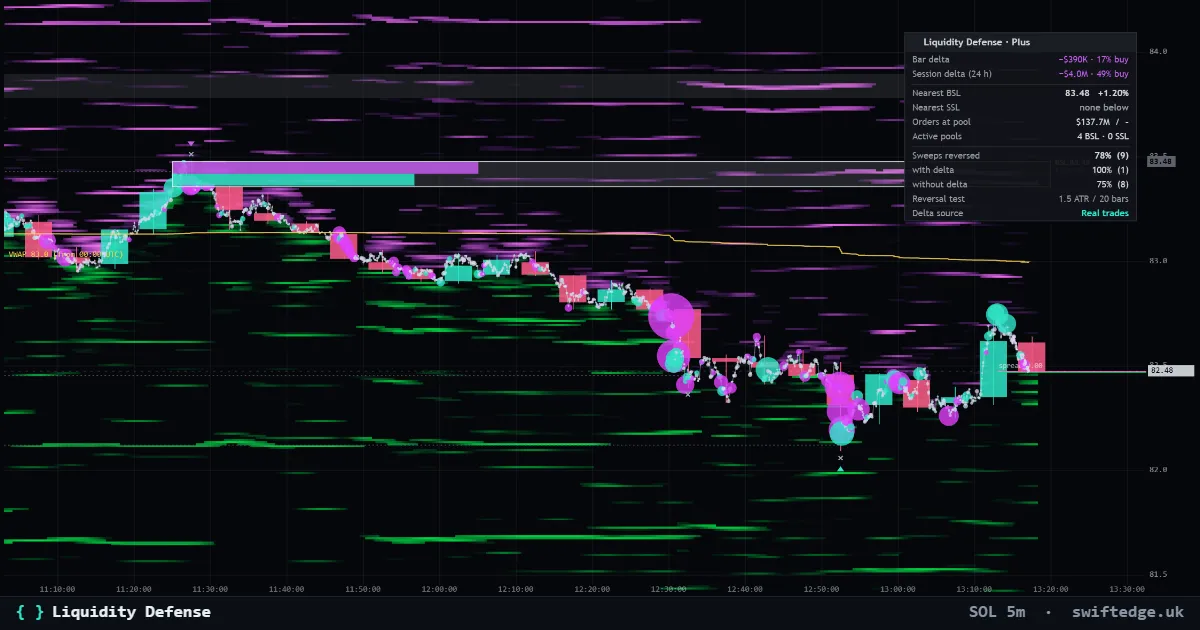
Buy-side and sell-side pools above highs and below lows with formation, defense profile and sweeps, from real trades, with the orders and liquidations at the nearest pools.
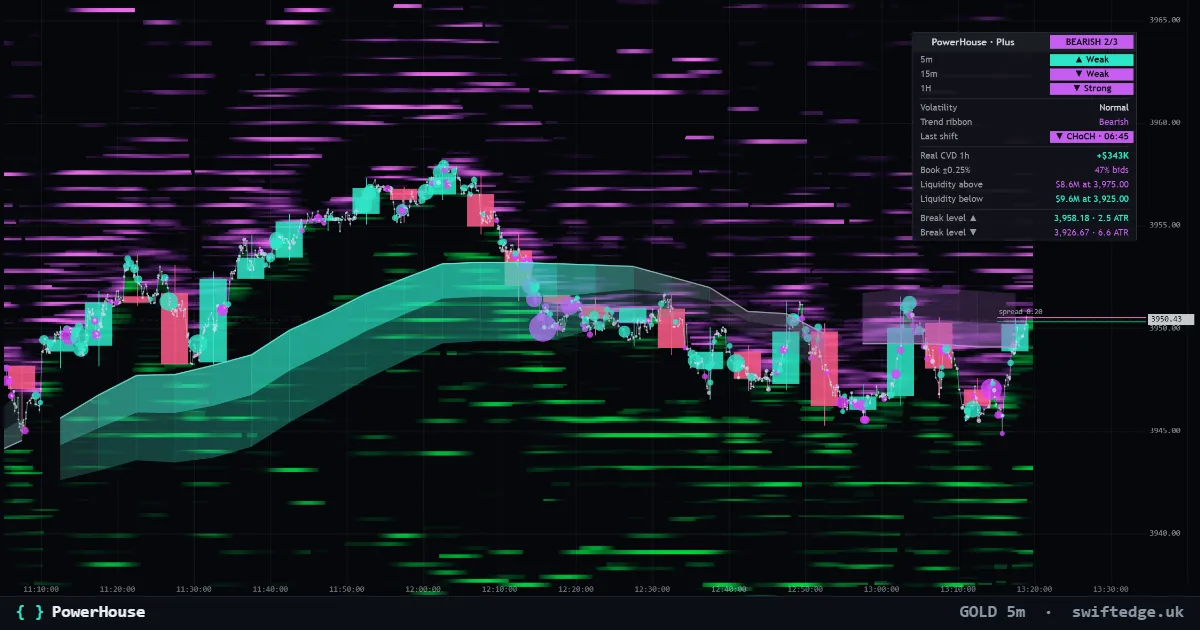
The adaptive trend ribbon, structure shifts (CHoCH and BOS) and a Trend Matrix, with the real walls and liquidation clusters above and below price.
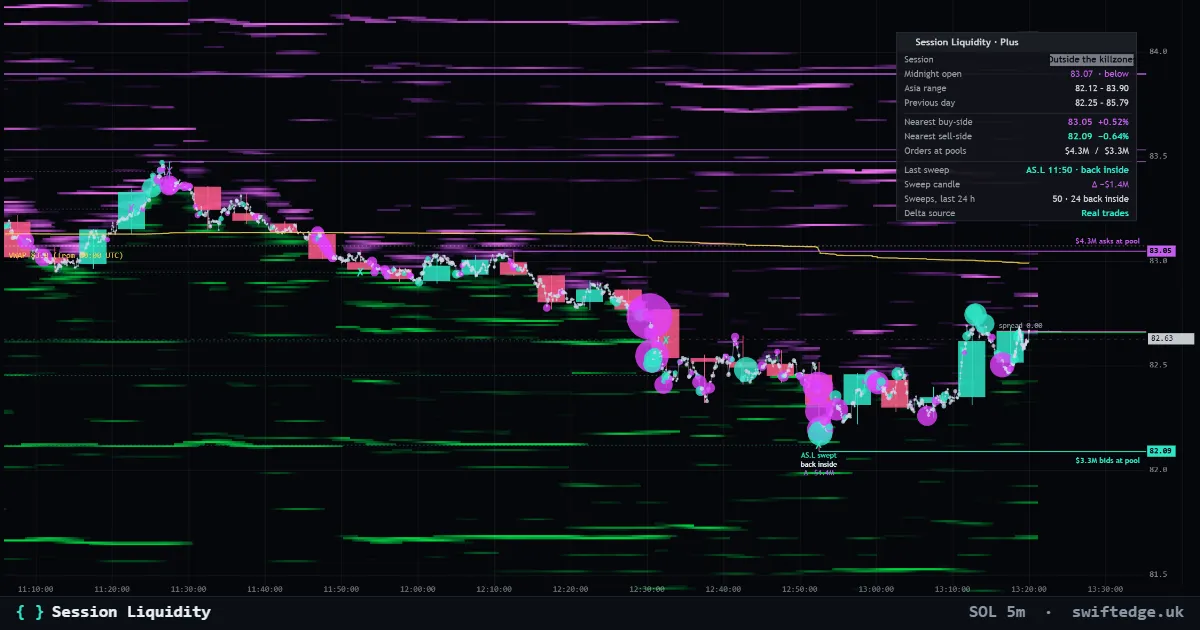
Asia, London and New York killzones with the session pools (Asia high and low, previous day high and low, equal highs and lows) and every sweep, with the real delta and liquidations of the sweep.