Community scripts › Authors
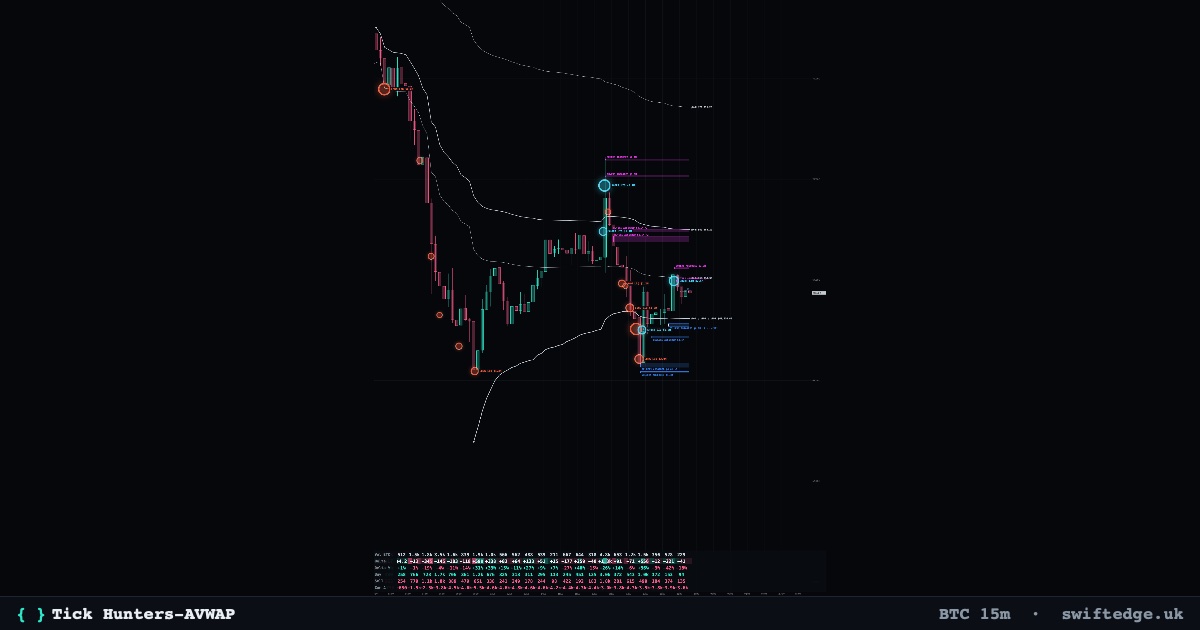
Plots up to 20 anchored VWAP curves on the price chart. Each curve starts at the high or low of the current or previous day, week, month, quarter, or year. Optional circles mark the anchor candles.