Community scripts › Tick Hunters-AVWAP
What it does
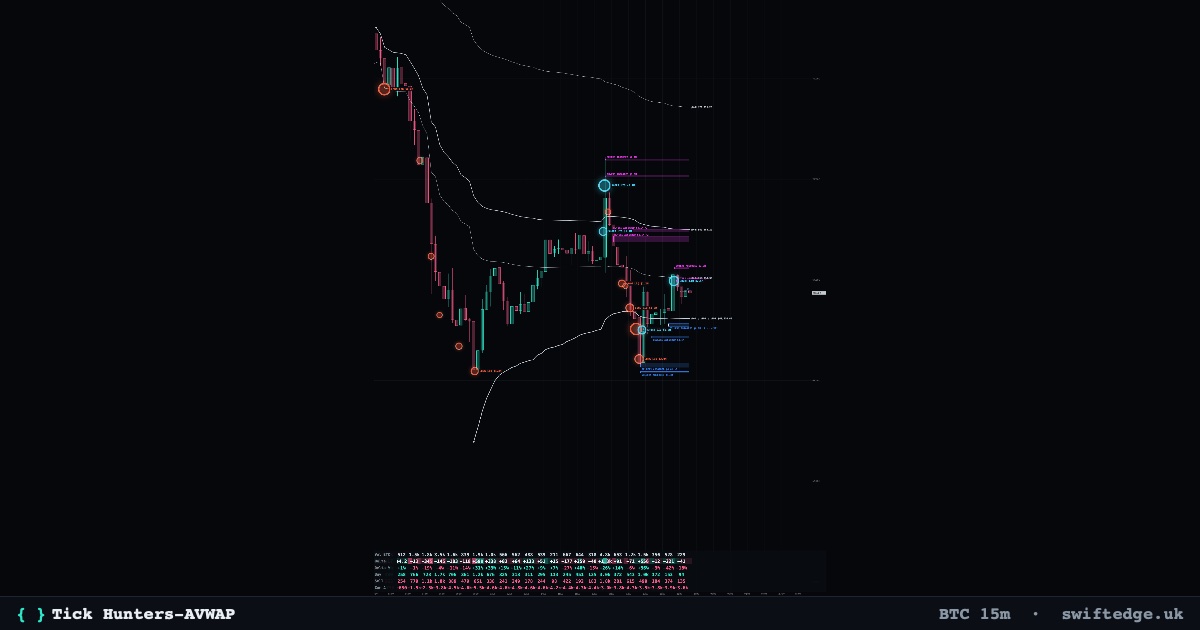
Plots up to 20 anchored VWAP curves on the price chart. Each curve starts at the high or low of the current or previous day, week, month, quarter, or year. Optional circles mark the anchor candles.
How it works
The script finds each period’s highest high and lowest low, then weights the selected price source by candle volume from the anchor candle through the live candle. Current anchors move when new extremes form. Previous anchors stay fixed after the period closes, while their VWAPs continue updating.
How to use it
Add the script to an intraday candle chart on a market with volume data. Enable the periods and anchors you want to compare. In the labels, cD-H means current day high and pW-L means previous week low. Choose Close, High, Low, or HLC3 as the price source. Periods use UTC by default, with weeks starting on Monday. Select Calendar periods to use another time zone.
What's original
This version of Tick Hunters brings both high and low anchors from developing and completed periods into one overlay across five timeframes. Previous-period curves carry forward into the current period, making it possible to compare them with curves from newly formed extremes. Labels that round to the same price merge to reduce clutter.
Limitations
The script uses up to 1,500 loaded candles. Longer periods may be hidden when their starts fall outside the available history. Turning off Hide incomplete starting periods shows estimates based on the candles available. A curve is also hidden if a candle straddles its period boundary or volume is missing between its anchor and the live candle.
Source code
Open source under MPL-2.0. Copy it with credit: "Copy to my scripts" adds the credit for you.
// Tick Hunters AVWAP, ported to the Swiftedge Depth Script Editor.
script({ name: "Tick Hunters-Current and Previous Period AVWAP" });

const periodMode = input.select("Swiftedge UTC periods", "Period boundaries", [
  "Swiftedge UTC periods", "Calendar periods",
]);
const timeZone = input.select("Etc/UTC", "Calendar time zone", [
  "Etc/UTC", "America/New_York", "Europe/London", "Asia/Dubai", "Asia/Tokyo", "Australia/Sydney",
]);
const hideIncomplete = input.bool(true, "Hide incomplete starting periods");

const lineStyles = ["Solid", "Dashed", "Dotted"];
const currentWidth = input.int(2, "Current line width", { min: 1, max: 5 });
const previousWidth = input.int(1, "Previous line width", { min: 1, max: 5 });
const currentStyle = input.select("Solid", "Current line style", lineStyles).toLowerCase();
const previousStyle = input.select("Solid", "Previous line style", lineStyles).toLowerCase();
const currentTransparency = input.int(0, "Current transparency", { min: 0, max: 100 });
const previousTransparency = input.int(40, "Previous transparency", { min: 0, max: 100 });
const showMarkers = input.bool(true, "Show active anchor markers");

const showLabels = input.bool(true, "Show labels");
const labelSize = input.select("Normal", "AVWAP label size", [
  "Tiny", "Small", "Normal", "Large", "Huge",
]).toLowerCase();
const compactLabels = input.bool(true, "Compact label text");
const showPrice = input.bool(true, "Show AVWAP price");
const labelOffset = input.int(3, "Label offset (bars)", { min: 0, max: 50 });
const labelStagger = input.int(1, "Label stagger (bars per line)", { min: 0, max: 15 });

const sourceOptions = ["Close", "High", "Low", "HLC3"];
const priceSources = { Close: close, High: high, Low: low, HLC3: hlc3 };
const highSource = priceSources[input.select("High", "High AVWAP source", sourceOptions)];
const lowSource = priceSources[input.select("Low", "Low AVWAP source", sourceOptions)];

const daySeconds = 86400;
const periods = [
  { name: "Day", code: "D", seconds: daySeconds, defaultColor: "#00D4AA" },
  { name: "Week", code: "W", seconds: 7 * daySeconds, defaultColor: "#4DA3FF" },
  { name: "Month", code: "M", seconds: 2628000, defaultColor: "#B388FF" },
  { name: "Quarter", code: "Q", seconds: 7884000, defaultColor: "#FFC857" },
  { name: "Year", code: "Y", seconds: 31536000, defaultColor: "#E6EDF3" },
];

function visibility(periodName) {
  return {
    show: input.bool(true, "Show " + periodName),
    high: input.bool(true, periodName + " high"),
    low: input.bool(true, periodName + " low"),
  };
}

for (const period of periods) {
  period.baseColor = input.color(period.defaultColor, period.name + " color");
  period.current = visibility("Current " + period.name);
  period.previous = visibility("Previous " + period.name);
}

const calendarMode = periodMode === "Calendar periods";
const dateFormat = new Intl.DateTimeFormat("en-GB", {
  timeZone: calendarMode ? timeZone : "Etc/UTC",
  year: "numeric", month: "numeric", day: "numeric",
});
const priceFormat = new Intl.NumberFormat("en-US", {
  style: "currency", currency: "USD", minimumFractionDigits: 2, maximumFractionDigits: 2,
});
const candleSeconds = Number(market.timeframe);
const lastBar = bars.length - 1;
const labels = new Map();

function periodKeys(seconds) {
  const date = dateFormat.formatToParts(seconds * 1000);
  const year = Number(date.find(part => part.type === "year").value);
  const month = Number(date.find(part => part.type === "month").value) - 1;
  const day = Number(date.find(part => part.type === "day").value);
  const localDate = new Date(Date.UTC(year, month, day));
  const mondayOffset = (localDate.getUTCDay() + 6) % 7;
  const dayKey = localDate.getTime() / (daySeconds * 1000);
  return [
    dayKey,
    dayKey - mondayOffset,
    year * 12 + month,
    year * 4 + Math.floor(month / 3),
    year,
  ];
}

function findAnchors(openKeys, endKeys, beforeFirst, periodIndex) {
  let current;
  let previous;
  for (let i = 0; i <= lastBar; i++) {
    const key = openKeys[i][periodIndex];
    const crossesBoundary = endKeys[i][periodIndex] !== key;
    if (!current || key !== current.key) {
      previous = current;
      const priorKey = i === 0 ? beforeFirst[periodIndex] : endKeys[i - 1][periodIndex];
      current = { key, complete: priorKey !== key, crossesBoundary, highBar: i, lowBar: i };
    } else {
      current.crossesBoundary = current.crossesBoundary || crossesBoundary;
      // Keep the earliest candle when highs or lows tie.
      if (high[i] > high[current.highBar]) current.highBar = i;
      if (low[i] < low[current.lowBar]) current.lowBar = i;
    }
  }
  return { current, previous };
}

function plotAvwap(code, anchorBar, anchorPrice, source, appearance) {
  const values = new Array(bars.length).fill(NaN);
  let sumVolume = 0;
  let sumPriceVolume = 0;

  // Previous-period anchors also accumulate every candle through the live bar.
  for (let i = anchorBar; i <= lastBar; i++) {
    const barVolume = volume[i];
    if (!Number.isFinite(barVolume) || barVolume < 0) return;
    if (barVolume > 0) {
      if (!Number.isFinite(source[i])) return;
      sumVolume += barVolume;
      sumPriceVolume += source[i] * barVolume;
    }
    if (sumVolume > 0) values[i] = sumPriceVolume / sumVolume;
  }

  const value = values[lastBar];
  if (!Number.isFinite(value)) return;
  plot.line("AVWAP " + code, values, appearance.line);
  if (showMarkers) {
    plot.shape(anchorBar, anchorPrice, { shape: "circle", size: "tiny", color: appearance.line.color });
  }
  if (showLabels) {
    const price = priceFormat.format(value);
    const existing = labels.get(price);
    if (existing) existing.codes.push(code);
    else labels.set(price, { value, color: appearance.labelColor, codes: [code] });
  }
}

function plotPeriod(period, anchors, options, isPrevious) {
  if (!options.show || !anchors || anchors.crossesBoundary || (hideIncomplete && !anchors.complete)) return;

  const transparency = isPrevious ? previousTransparency : currentTransparency;
  const appearance = {
    line: {
      color: color.new(period.baseColor, 1 - transparency / 100),
      width: isPrevious ? previousWidth : currentWidth,
      style: isPrevious ? previousStyle : currentStyle,
    },
    labelColor: isPrevious ? color.new(period.baseColor, 0.8) : period.baseColor,
  };
  const prefix = (isPrevious ? "p" : "c") + period.code;
  if (options.high) plotAvwap(prefix + "-H", anchors.highBar, high[anchors.highBar], highSource, appearance);
  if (options.low) plotAvwap(prefix + "-L", anchors.lowBar, low[anchors.lowBar], lowSource, appearance);
}

if (lastBar >= 0 && Number.isFinite(candleSeconds) && candleSeconds > 0 &&
    (!calendarMode || candleSeconds < daySeconds)) {
  const openKeys = time.map(periodKeys);
  // Swiftedge supplies candle opens and a timeframe in seconds. Use the last
  // second inside each candle so a close exactly on a boundary is valid.
  const endKeys = time.map(seconds => periodKeys(seconds + candleSeconds - 1));
  const beforeFirst = periodKeys(time[0] - 1);

  periods.forEach((period, index) => {
    if (candleSeconds >= period.seconds) return;
    const anchors = findAnchors(openKeys, endKeys, beforeFirst, index);
    plotPeriod(period, anchors.current, period.current, false);
    plotPeriod(period, anchors.previous, period.previous, true);
  });

  let slot = 0;
  for (const [price, label] of labels) {
    const text = (compactLabels ? "" : "AVWAP ") + label.codes.join(" / ") + (showPrice ? " " + price : "");
    plot.label(lastBar + labelOffset + slot * labelStagger, label.value, text, {
      color: label.color, textColor: label.color, background: "transparent", size: labelSize, align: "left",
    });
    slot++;
  }
}