What happened
Written from the data, not opinion.
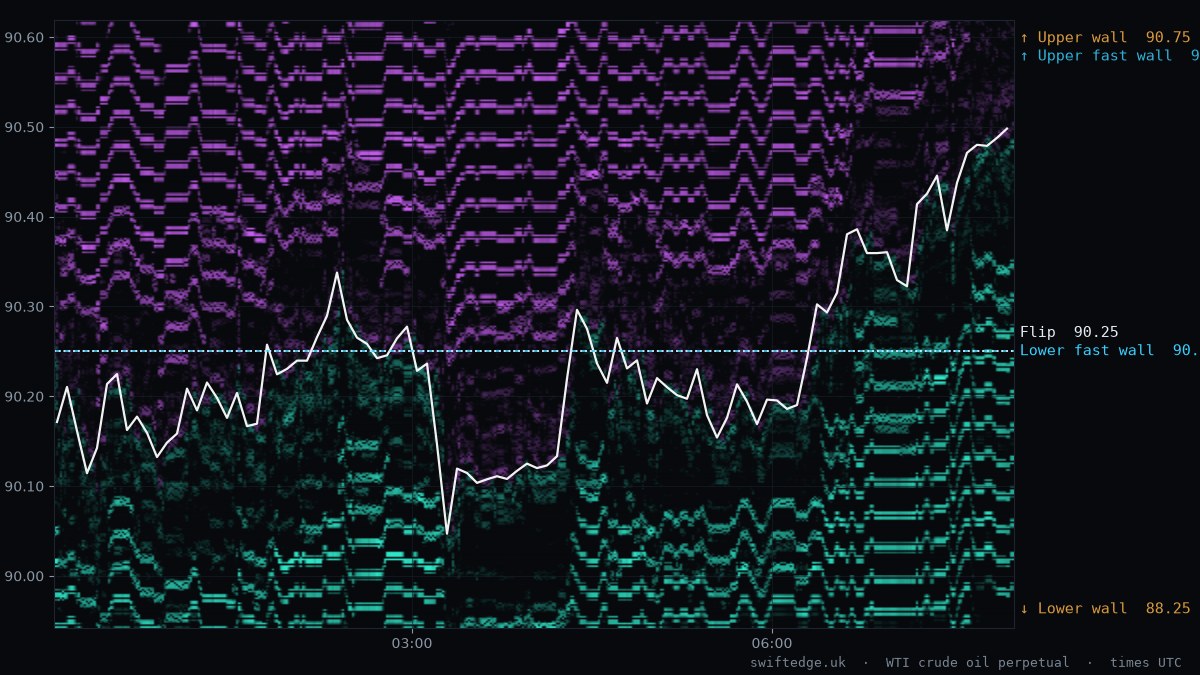
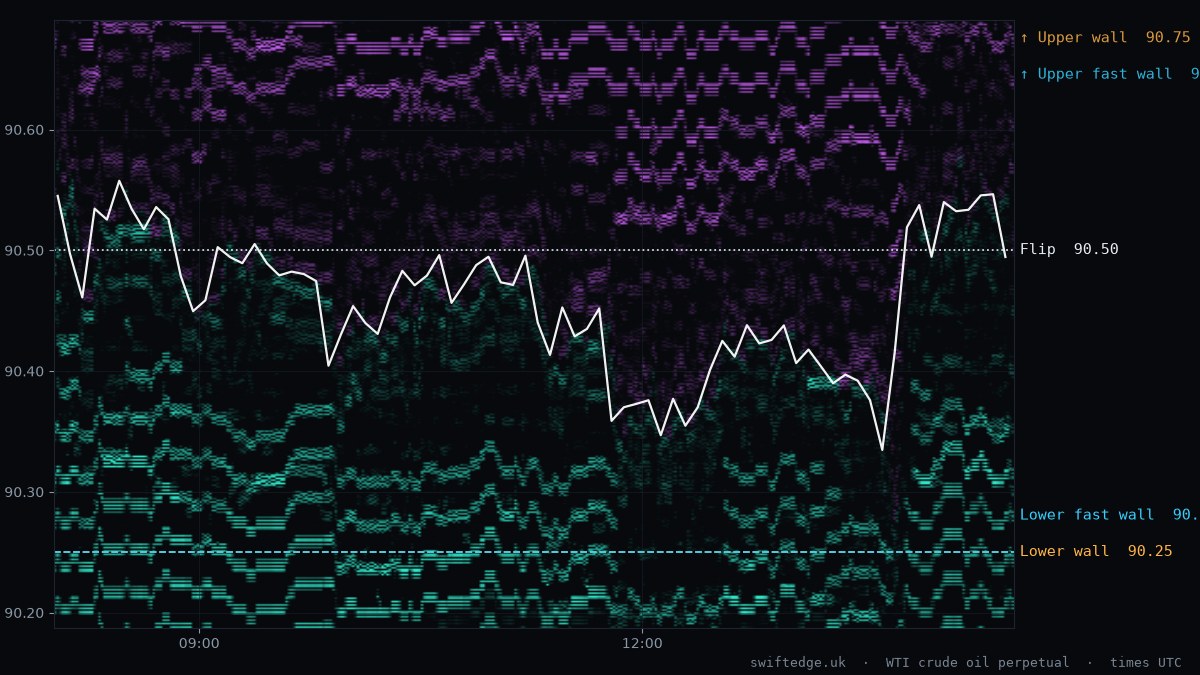
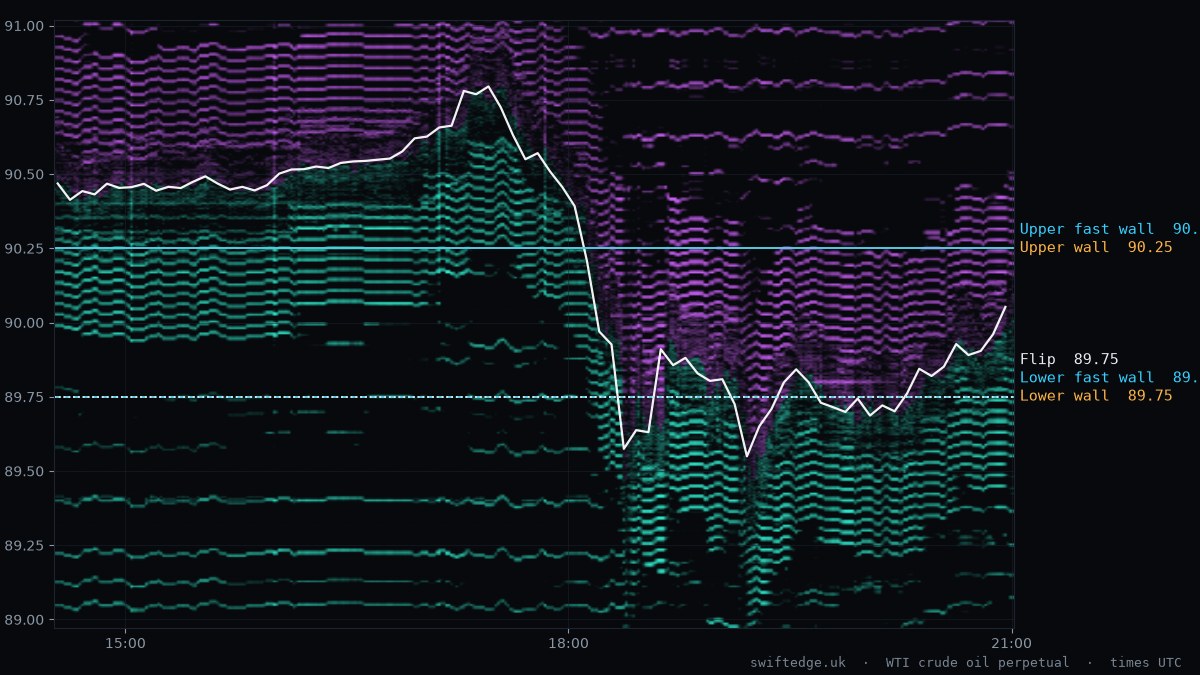
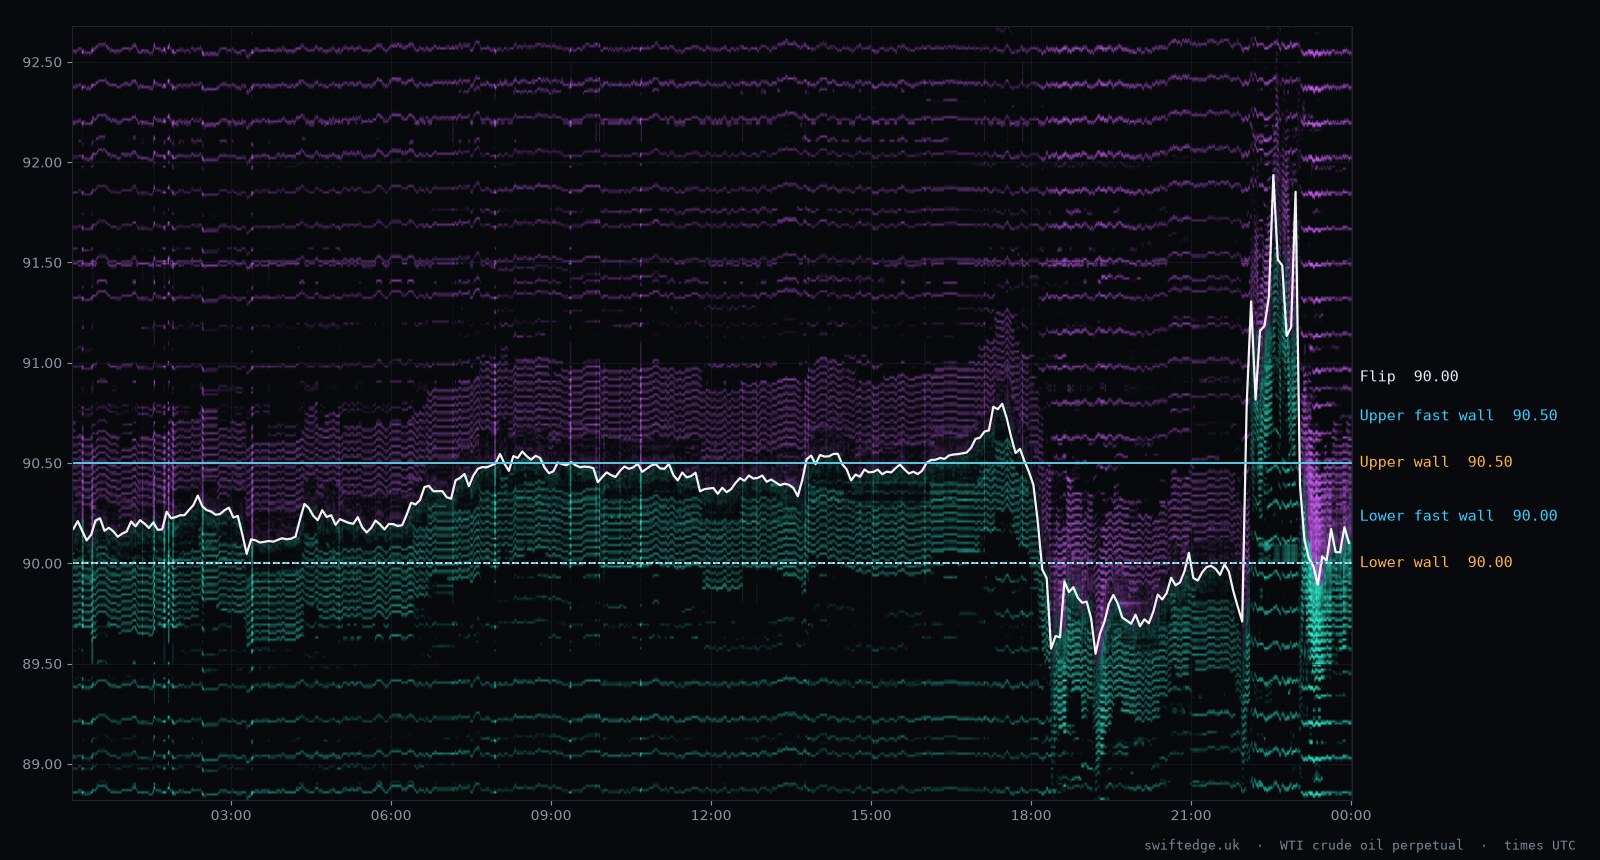
Positioning puts the upper wall at 90.50 and the lower wall at 90.00.
Live now: WTI levels today, walls and positioning →
Economic calendar: the next CPI, FOMC and jobs report dates →
WTI closed down 0.15 % on the day, trading between 89.18 and 92.32. The high came at 5:55 PM ET (22:55 UTC) and the low at 1:20 PM ET (18:20 UTC).
±3.5 % around price · at the close
Asia, London and New York, each summed up when it closes. Times follow local opening hours.
Written from the data, not opinion.
Positioning puts the upper wall at 90.50 and the lower wall at 90.00.
Classified from every trade at the wall's own price, not from candles. What is a liquidity wall?
| Event | Wall | Time |
|---|---|---|
| No clean wall event today. A wall only counts when the trades at its own price prove what happened. | ||
Where public open positions would be liquidated, by price: the upper wall, lower wall, flip and fast walls (20x leverage or more). It is an estimate from part of the market's positions. Looking for the call wall, put wall or gamma flip? These are the same kind of levels, built from where traders hold positions rather than from options. End of day.
| Upper wall Largest cluster of liquidations above the price (our call wall alternative) | 90.50 |
| Lower wall Largest cluster of liquidations below the price (our put wall alternative) | 90.00 from 87.75 |
| Flip Where liquidations below equal liquidations above (our gamma flip alternative) | 90.00 |
| Upper fast wall Positions with 20x leverage or more | 90.50 |
| Lower fast wall Positions with 20x leverage or more | 90.00 from 89.75 |
Largest walls within 2.5 % of price.
See every wall form and disappear, live.The same data as this report, second by second, free in your browser.
Open DepthMethod. Price, volume and order book from perpetual futures. Positioning shows where public open positions would be liquidated, by price; it is an estimate from part of the market's positions. A wall is "held" when trades hit it and price turned, "pulled" when it vanished within seconds with almost nothing traded, "eaten" when most of it was traded away. Times are New York time (ET), with UTC in brackets. Updated 09 Nov 7:07 PM ET the evening before (00:07 UTC).