Guide
What is GEX? Gamma exposure in Bitcoin options
Gamma exposure, or GEX, is an estimate of how much options dealers would have to buy or sell to stay hedged as the price moves. It turns the options market's open positions into a map of where hedging flows could lean against a move and where they could lean with it. It is a model, and the most useful thing you can know about it is which parts are measured and which parts are assumed.
The idea in one paragraph
Options dealers usually try not to bet on direction. When they sell or buy an option they hedge its delta (how much its value moves with price) with futures or spot. But an option's delta changes as price moves, and the rate of that change is gamma. So a dealer holding options has to keep re-hedging: buying or selling more of the underlying every time price moves. Add that up over every open option and you get gamma exposure: how much hedging a 1 % move would require, and in which direction.
How GEX is calculated
For each option contract, Swiftedge computes Black-Scholes gamma from the contract's own mark implied volatility and time to expiry, then scales it to dollars:
GEX(price) = Σ sign × gamma × open interest (BTC) × price² × 1 %
The result is in USD per 1 % move. sign = +1 for calls and −1 for puts under the standard assumption.
- Venues: BTC options on Deribit, OKX and Bybit. Deribit holds the large majority of open interest (about 88 % when we last measured), OKX and Bybit the rest.
- Grid: GEX is evaluated every 250 USD from about 12 % below to 12 % above the price, so you can see how the hedging need would change if price moved there.
- Time: options expiring within 24 hours (0DTE) are kept separate from later expiries, because their gamma is concentrated close to price and disappears at the 08:00 UTC settlement.
- Check: our gamma values match the exchange's own published greeks to within a few percent.
The part nobody can measure: who holds the options
Open interest tells you how many contracts exist at a strike. It does not tell you who is long and who is short. Every GEX number therefore rests on an assumption about dealer positioning. The common one, used by default for the GEX levels, is that dealers are long calls and short puts: customers sell calls against holdings and buy puts as protection.
Swiftedge also offers a second estimate: dealer positions rebuilt from Deribit trade flow, treating the taker of each trade as the customer and the maker as the dealer. It covers Deribit only, because the other venues do not publish free trade history. The two methods disagree more than you might expect: in our data the flow-based sign matched the standard assumption on only about half of the open interest, and the estimated flip moved by roughly 2,700 USD between them. Where they disagree, treat the picture as uncertain.
How to read GEX on the chart
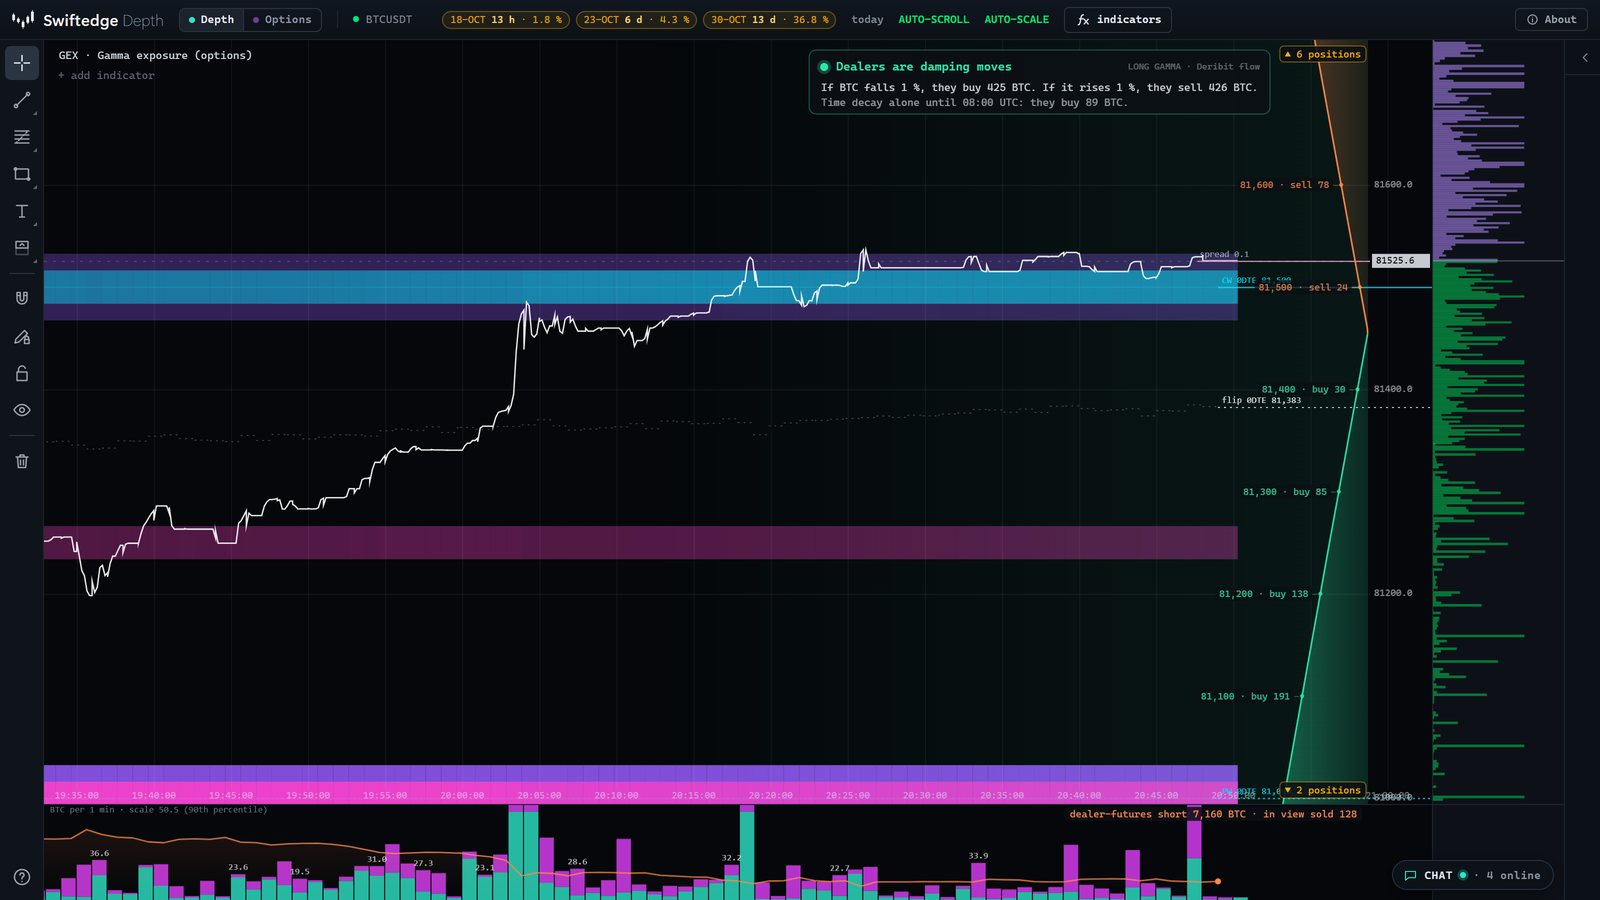
In Swiftedge Depth, the GEX indicator draws a band at each strike with large estimated gamma: narrow bands for the same-day expiry, wide bands for later expiries. The dotted line is the gamma flip. The labels CW and PW are the call wall and put wall. The column at the right edge is the estimated dealer hedge at each price, and the card at the top sums up the current regime, for example "dealers are damping moves" when the model says they are long gamma.
Positive and negative GEX
- Positive GEX (dealers long gamma): to stay hedged, dealers sell as price rises and buy as it falls. In theory that leans against moves.
- Negative GEX (dealers short gamma): dealers buy as price rises and sell as it falls, which in theory adds to moves.
The dealer hedging guide walks through the mechanics with numbers.
What our own data shows
We test our own indicators before we describe them. These results come from Bitcoin data between January and October 2026, with the test rules written down before we looked at the outcome.
- Calmer, not directional. Hours the model classed as long gamma were about 19 % less volatile in the following hour than the rest. But once current volatility and time of day were taken into account, the regime added almost nothing, and it said nothing about direction.
- The hedge is hard to see. We looked for the model's predicted dealer hedging in aggressive futures trading, futures volume, the passive order book and resting liquidity at the walls. None showed it clearly.
- Walls are not floors and ceilings. Price broke through the GEX walls more often than through random levels at the same distance.
One likely reason: Bitcoin's options market is small next to its futures market. The estimated hedging need is typically in the order of 100 million dollars per 1 % move, while BTC perpetual futures trade many billions of dollars a day.
What GEX is good for. It is a clear way to see where options positions are concentrated, how the same-day expiry changes the picture and how sensitive estimated hedging is to price. It is context, not a trigger.
See GEX on live data.In Swiftedge Depth, open + add indicator and choose GEX to draw the gamma bands, the flip, the call and put walls and the estimated dealer hedge on the live Bitcoin order book. Free, no sign-up.
Open Swiftedge DepthCommon questions
Is GEX a buy or sell signal?
No. GEX describes how estimated dealer hedging changes with price. It does not say where price will go, and in our own tests the GEX levels did not act as reliable support or resistance for Bitcoin.
Why do different sites show different GEX numbers for Bitcoin?
Because the biggest input is an assumption: who holds which options. Sites use different sign rules, venues, expiry filters and grids. Ours uses Deribit, OKX and Bybit, a 250 USD grid and, by default, the standard dealer long calls / short puts assumption.
How often does Swiftedge update GEX?
A new snapshot of every BTC option on Deribit, OKX and Bybit is taken about once a minute, and the levels are recalculated from it.