Guide
How to read the Swiftedge options chain
Read it in one line: each row is a strike, calls grow to the left, puts to the right, and taller rows are where option prices put the most likely settlement. Everything else in Swiftedge Options adds context to that picture: what traded today, where dealer hedging is estimated to sit, and what the futures order book is doing right now.
The layout: strikes, calls and puts
The chain is a vertical price ladder. Each row is a strike, with high strikes on top, and the white line across the middle is the live BTC price. Call open interest grows to the left of the strike labels and put open interest to the right, so the longest bars are the strikes where the most contracts are open on Deribit, OKX and Bybit combined.
The tabs at the top choose the expiry: daily, weekly, monthly or quarterly, or All expiries at once. The line above the chain sums it up in words: where options centre, the biggest bets, which side dominated today and the nearest futures walls.
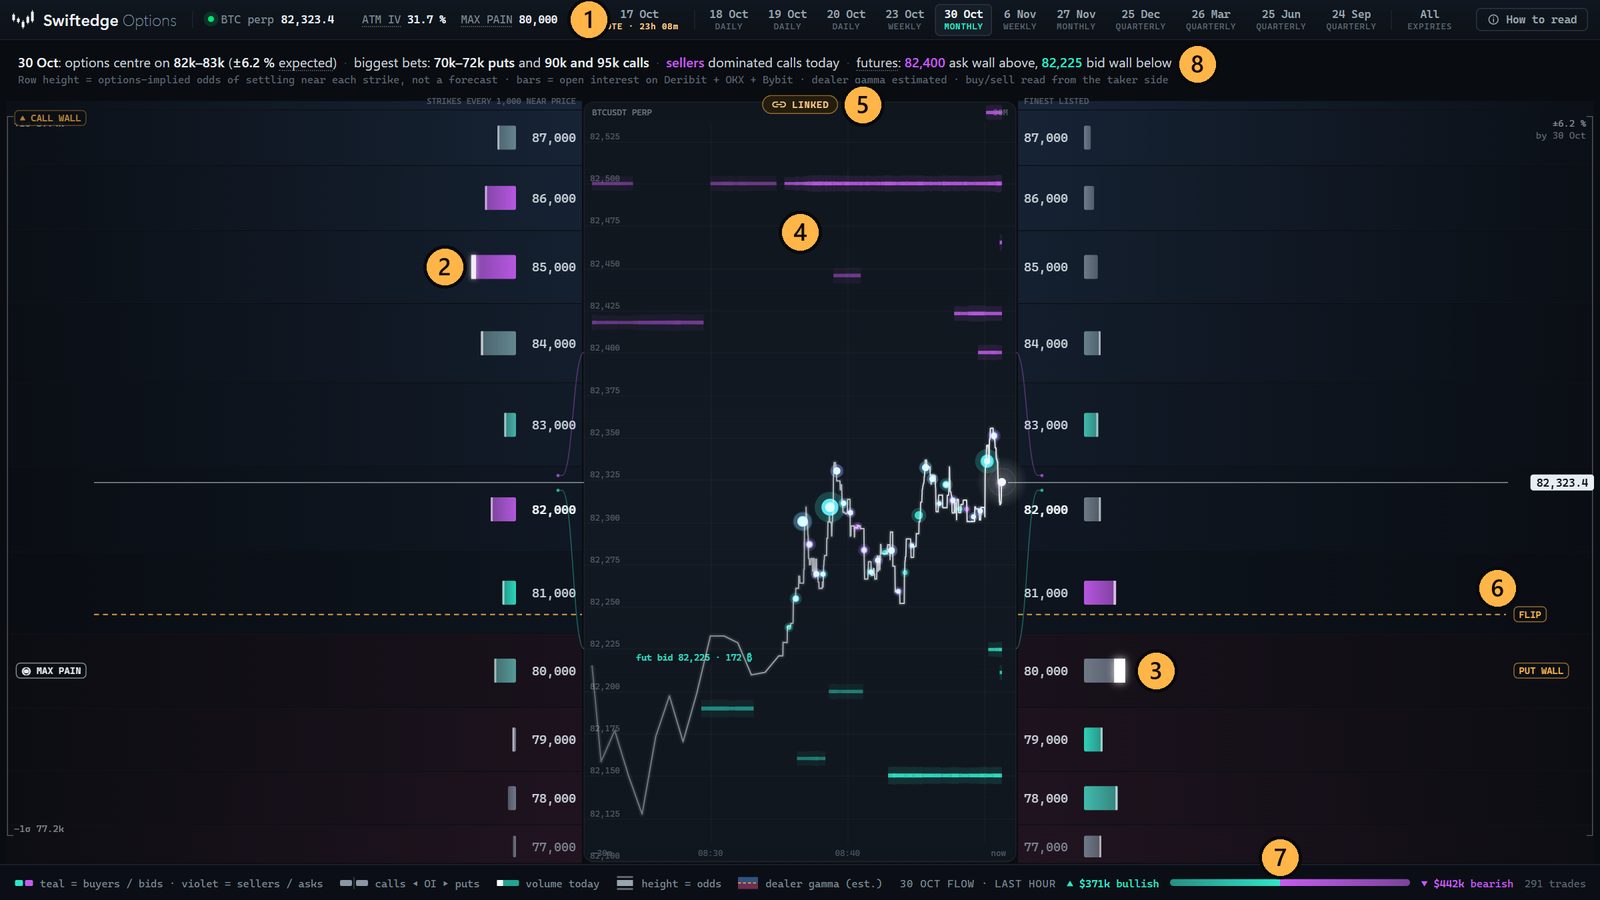
- Expiry tabs, plus All expiries
- Call open interest grows left
- Put open interest grows right; white line = today's volume
- The futures spine: mini Depth of the BTCUSDT perpetual
- LINK lines the live price up with the chain
- Level tags: call wall, put wall, gamma flip, max pain (estimated)
- Options money flow, last hour
- The one-line summary
Row height: what options imply, not a forecast
Rows are not all the same height. A taller row is a strike where today's option prices imply BTC is more likely to settle at the selected expiry. These are options-implied (risk-neutral) odds, read from the implied volatility smile, so the chain bulges where options price the most likely outcomes. Rows keep a minimum height so the far strikes stay readable.
Thin brackets at the edges mark the ±1σ expected move, roughly the range that holds two in three of the outcomes options price. A short-dated expiry has a narrow bracket; a quarterly one is wide.
Odds are a price, not a prediction. Implied odds describe what it costs to buy protection or exposure at each strike. They move with every trade and quote, and BTC can and does settle outside the tallest rows.
Bars: open interest, today's flow and volume
Bar length is open interest in BTC. Bar colour shows who was aggressive at that strike today, read from the taker side of each trade: teal when buyers crossed the spread, violet when sellers did, a muted neutral when it was roughly balanced. The thin white line inside the bar is today's traded volume relative to open interest, so a long bar with a long white line is a strike that is both heavily held and actively traded today.
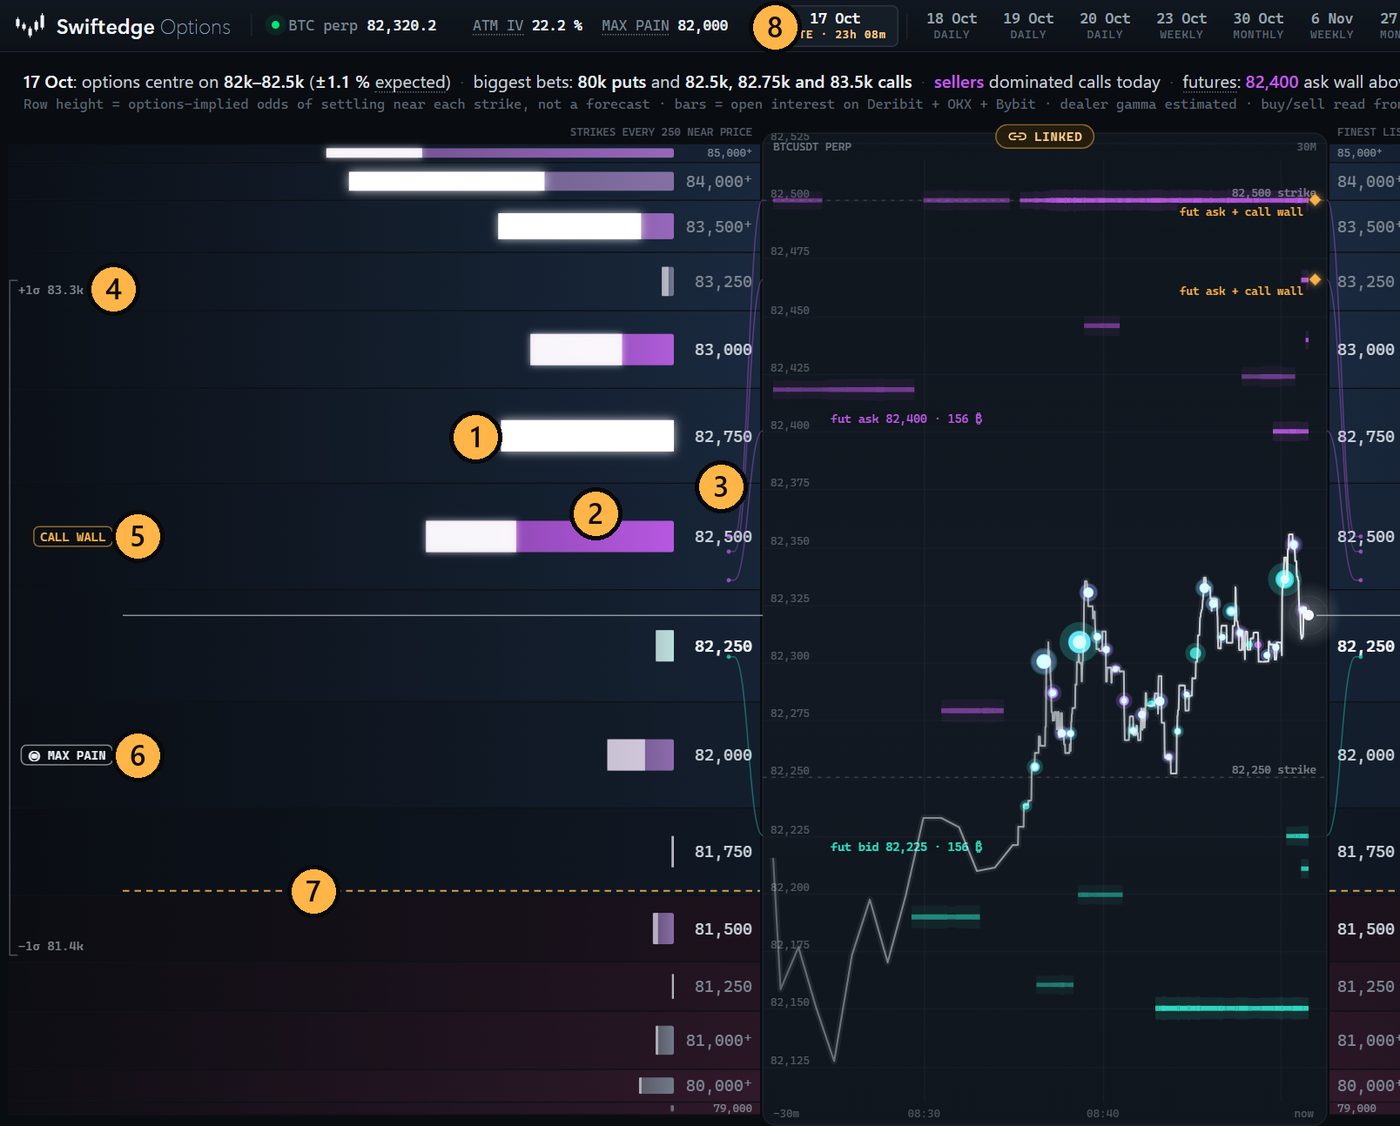
- White line: today's traded volume
- Violet: sellers were aggressive at this strike today
- Taller row: higher options-implied odds
- ±1σ expected move bracket
- Call wall tag (estimated)
- Max pain tag
- Gamma flip, dashed amber (estimated)
- The 0DTE expiry tab
Gamma zones and level tags
The soft glow behind the rows is estimated dealer gamma. Blue rows are where estimated dealer hedging leans against moves (they would buy dips and sell rallies); pink rows are where it leans with them. The dashed amber line between them is the gamma flip. Tags at the edges mark the call wall and put wall, the strikes with the largest estimated call and put gamma, and max pain, the settlement price at which option holders together would collect the least.
Dealer positions are not public. The glow, the walls and the flip are estimated under the standard assumption that dealers are long calls and short puts. Max pain is arithmetic on open interest, not a target. An optional Dealer desk (est.) indicator, under + add indicator, adds an estimated hedge column by price and a card with the dealer regime; it can also use Deribit positions rebuilt from trade flow.
The futures spine
The panel in the middle is a mini Swiftedge Depth for the Binance BTCUSDT perpetual, always ending at now: the white price trail, the biggest futures walls as glowing streaks (violet asks, teal bids) and futures trades as bubbles. It has its own price zoom, so the futures detail stays readable while the chain shows whole strikes. LINK keeps the live price at the same height on the spine as on the chain, so one white line runs straight across; thin connectors at the spine's edges show where the biggest futures walls sit on the strike scale.
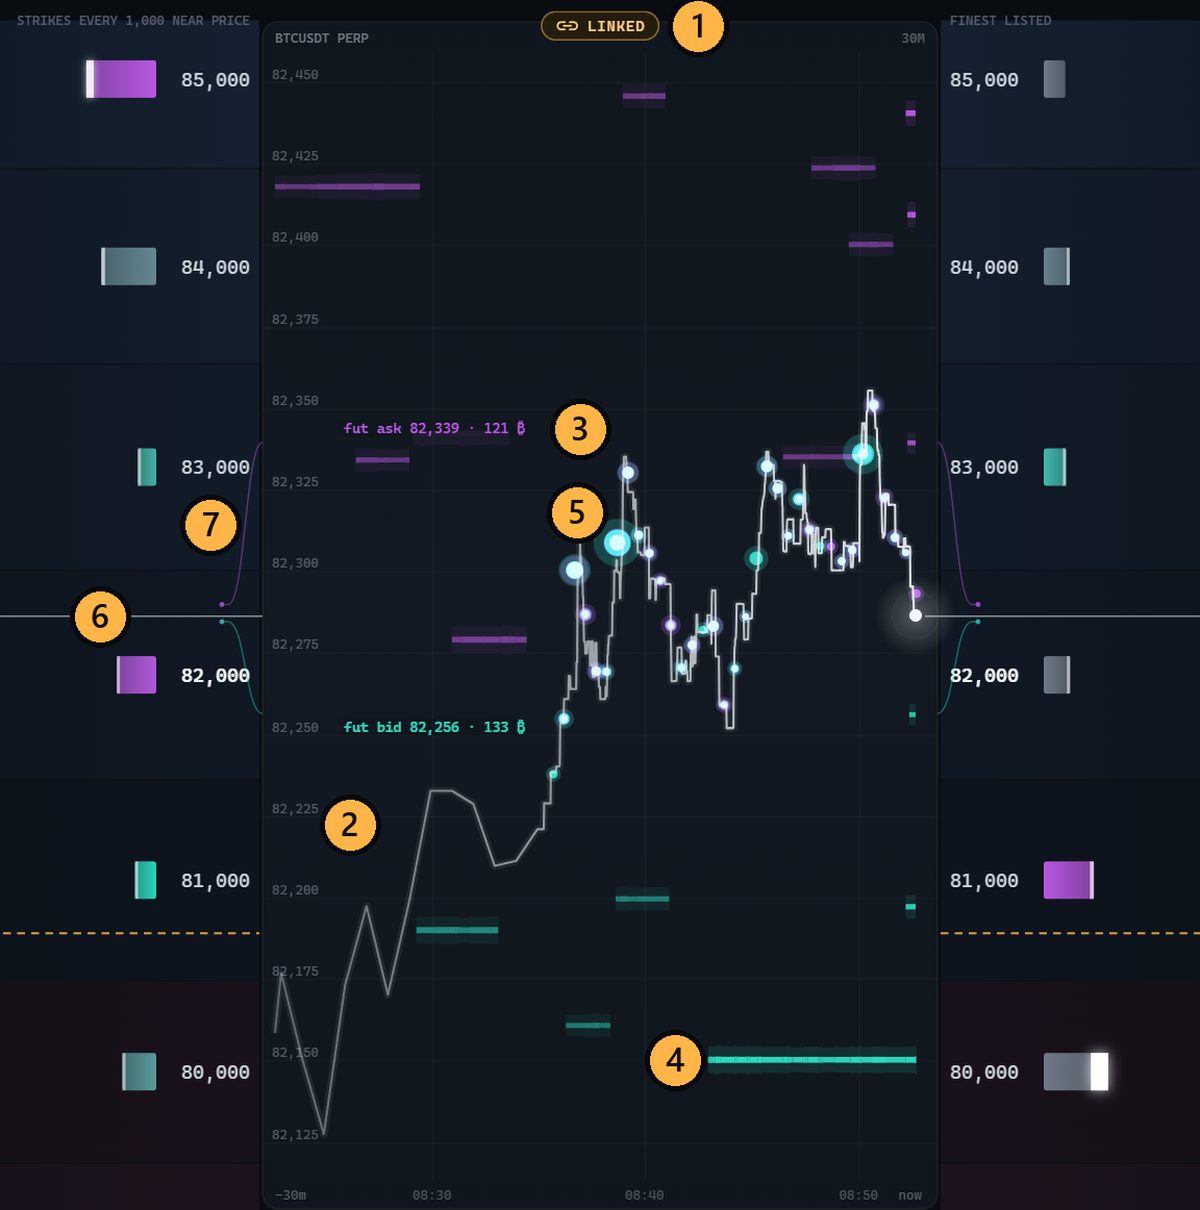
- LINK: live price at the same height on both scales
- Price trail of the BTCUSDT perpetual
- A futures ask wall (violet)
- A futures bid wall (teal)
- Futures trades as bubbles
- The live price line, carried across the chain
- Connectors: where the spine's range sits on the strike scale
Live trades and the money flow strip
Option trades fly in from the edges and merge into their strike: teal when bought, violet when sold, a white ring for a block trade. The strip along the bottom sums the last hour of options premium as bullish premium (calls bought plus puts sold) against bearish premium (puts bought plus calls sold), with direction from the taker of each trade. Premium is money paid, not exposure.
A two-minute routine
- Pick the expiry you care about, often the nearest daily or the monthly.
- Find the tallest rows and the ±1σ bracket: that is the range options are pricing.
- Find the longest bars and their colour: where positions sit, and who was pushing today.
- Note the call wall, put wall, flip and max pain, remembering they are estimates.
- Look at the spine: is the futures book stacking or thinning near one of those levels?
Open the live chain.Swiftedge Options shows the BTC options chain from Deribit, OKX and Bybit with a live futures spine, free in the browser and with no sign-up.
Open Swiftedge OptionsCommon questions
Is the row height a prediction of where Bitcoin will go?
No. Row height shows options-implied (risk-neutral) odds: the outcomes today's option prices put the most weight on at the selected expiry. It describes what options cost. Markets often settle outside the tallest rows.
Where does the options data come from?
From BTC options on Deribit, OKX and Bybit: open interest, quotes and trades. The futures spine in the middle uses the Binance BTCUSDT perpetual, the same market as Swiftedge Depth.
Are the call wall and put wall real orders?
No. They are strikes where estimated dealer gamma is largest for the selected expiry. Dealer positions are not public, so the levels rest on the standard assumption that dealers are long calls and short puts. The walls on the futures spine are different: they are real resting orders in the futures book, and they can be pulled at any time.