₿BitcoinAuGoldΞEthereum◎Solana
TodayDaily archiveWeekly
Daily market structure SOLUSDT perpetualFinal

Solana on Monday, 26 October 2026

SOL closed down 0.41 % on the day, trading between 99.81 and 102.71. The high came at 15:20 UTC and the low at 03:50 UTC.

CLOSE · 26 Oct 2026
100.9
▼ -0.41 % on the day
Low 99.81High 102.7
bid wall 99ask wall 101.3
– – open 101.3
00:0006:0012:0018:0024:00 UTC
Range2.9099.81 – 102.71
Volume13,212,211SOL traded
Dealer regimeShort gammaHedging adds to moves
Wall events00 eaten · 0 pulled · 0 held

Levels around the price

±3.5 % around price · at the close

989910010110210310499 · 42,009 SOL99.30 · 21,728 SOL101.3 · 26,737 SOL102 · 20,540 SOLCall wall 103 (+2.1 %)Put wall 103 (+2.1 %)Gamma flip 101.6 (+0.7 %)Call wall 0DTE 101 (+0.1 %)Put wall 0DTE 101 (+0.1 %)100.9
989910010110210310499 · 42,00999.30 · 21,72899.55 · 21,699101.3 · 26,737102 · 20,540101.1 · 19,074CW 103PW 103Flip 101.6CW 0DTE 101PW 0DTE 101100.9
bid wallsask wallscall/put wall0DTEmax pain

The day on one line

Asia-0.64 %London+0.48 %New York-0.71 %00:0003:0006:0009:0012:0015:0018:0021:0024:00
Asia-0.64 %London+0.48 %New York-0.71 %00:0006:0012:0018:0024:00

Sessions

Asia, London and New York, each summed up when it closes. Times follow local opening hours.
Asia
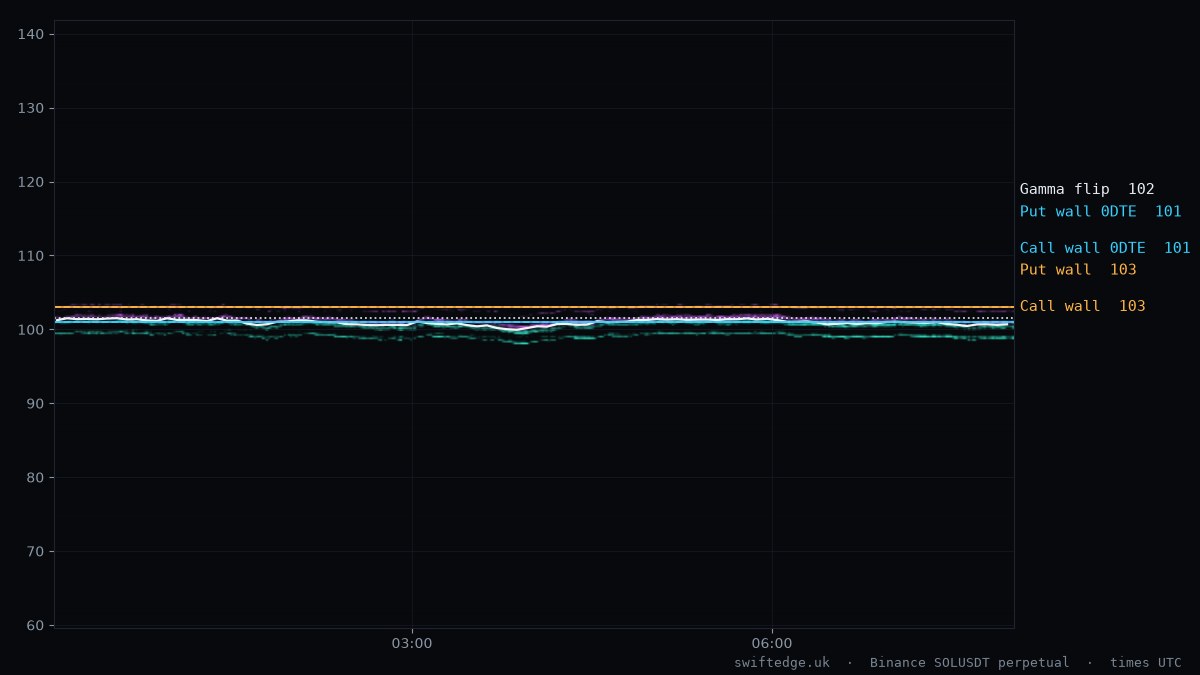
00:00–08:00 UTC
Closed
−0.64 %
99.81 – 101.64  ·  range 1.83
high 00:30 UTC  ·  low 03:50 UTC  ·  4,505,576 SOL
No clean wall event in this session.
Short gamma  ·  CW 103.00  ·  PW 103.00
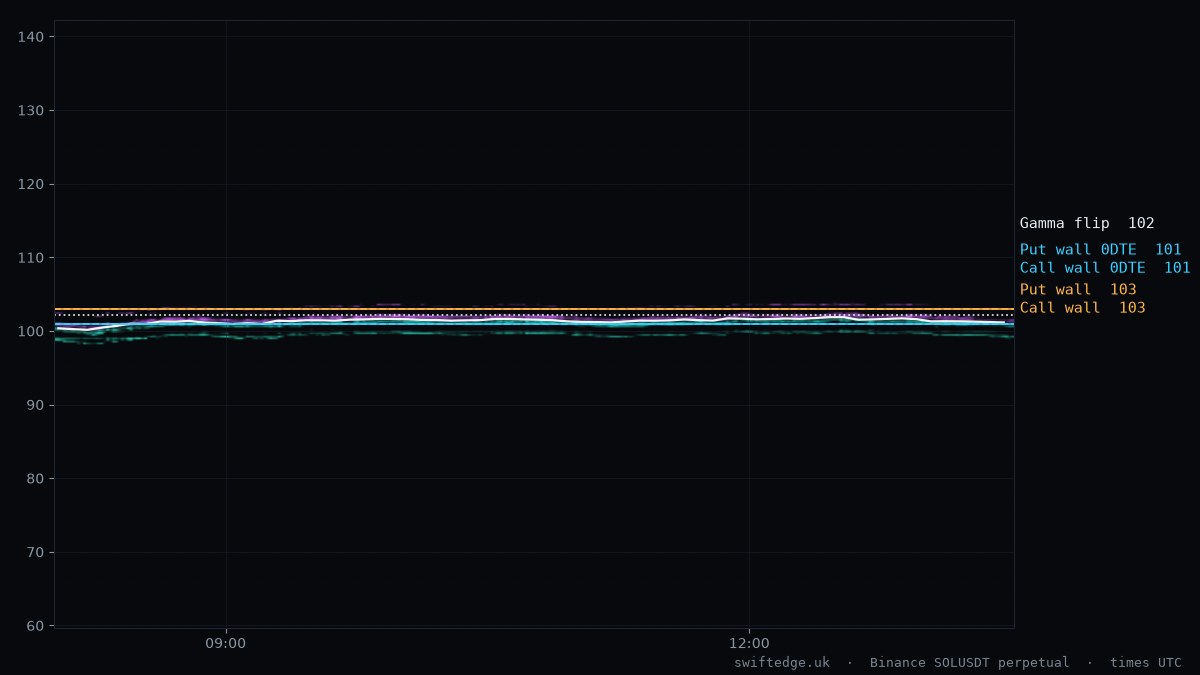
SOL order book heatmap, Asia session, 26 Oct 2026
London
08:00–13:30 UTC
Closed
+0.48 %
99.90 – 101.99  ·  range 2.09
high 11:55 UTC  ·  low 08:10 UTC  ·  2,378,239 SOL
No clean wall event in this session.
Short gamma  ·  CW 103.00  ·  PW 103.00
SOL order book heatmap, London session, 26 Oct 2026
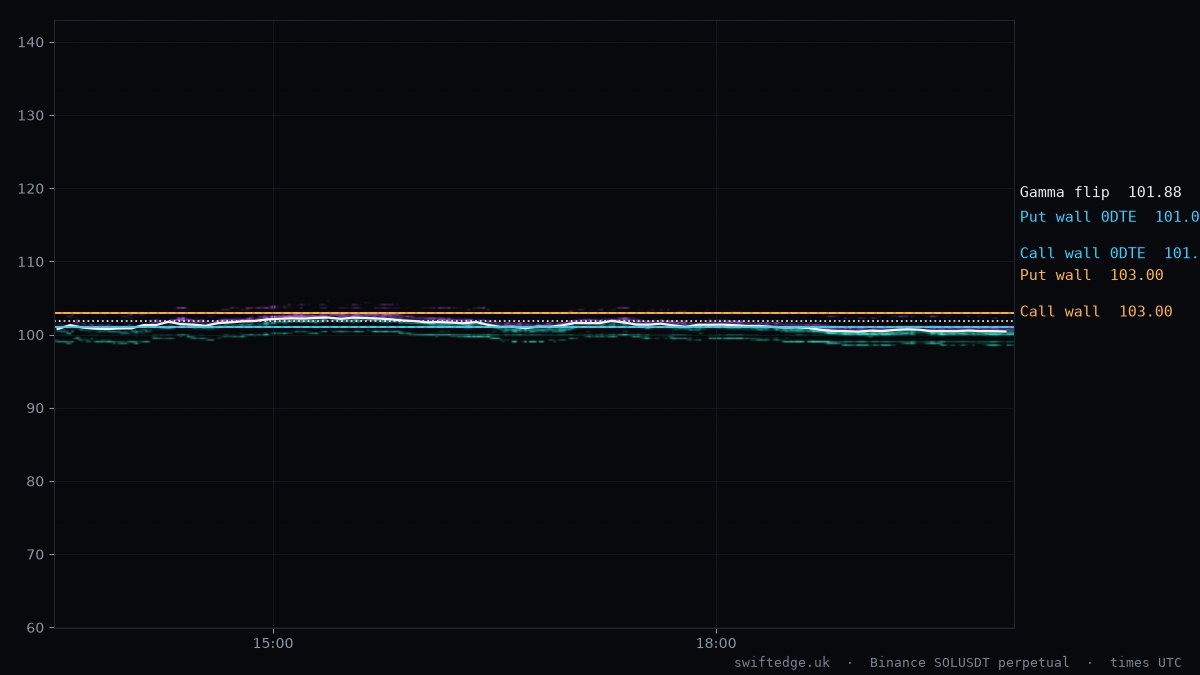
New York
13:30–20:00 UTC
Closed
−0.71 %
100.20 – 102.71  ·  range 2.51
high 15:20 UTC  ·  low 19:00 UTC  ·  5,112,843 SOL
No clean wall event in this session.
Short gamma  ·  CW 103.00  ·  PW 103.00
SOL order book heatmap, New York session, 26 Oct 2026
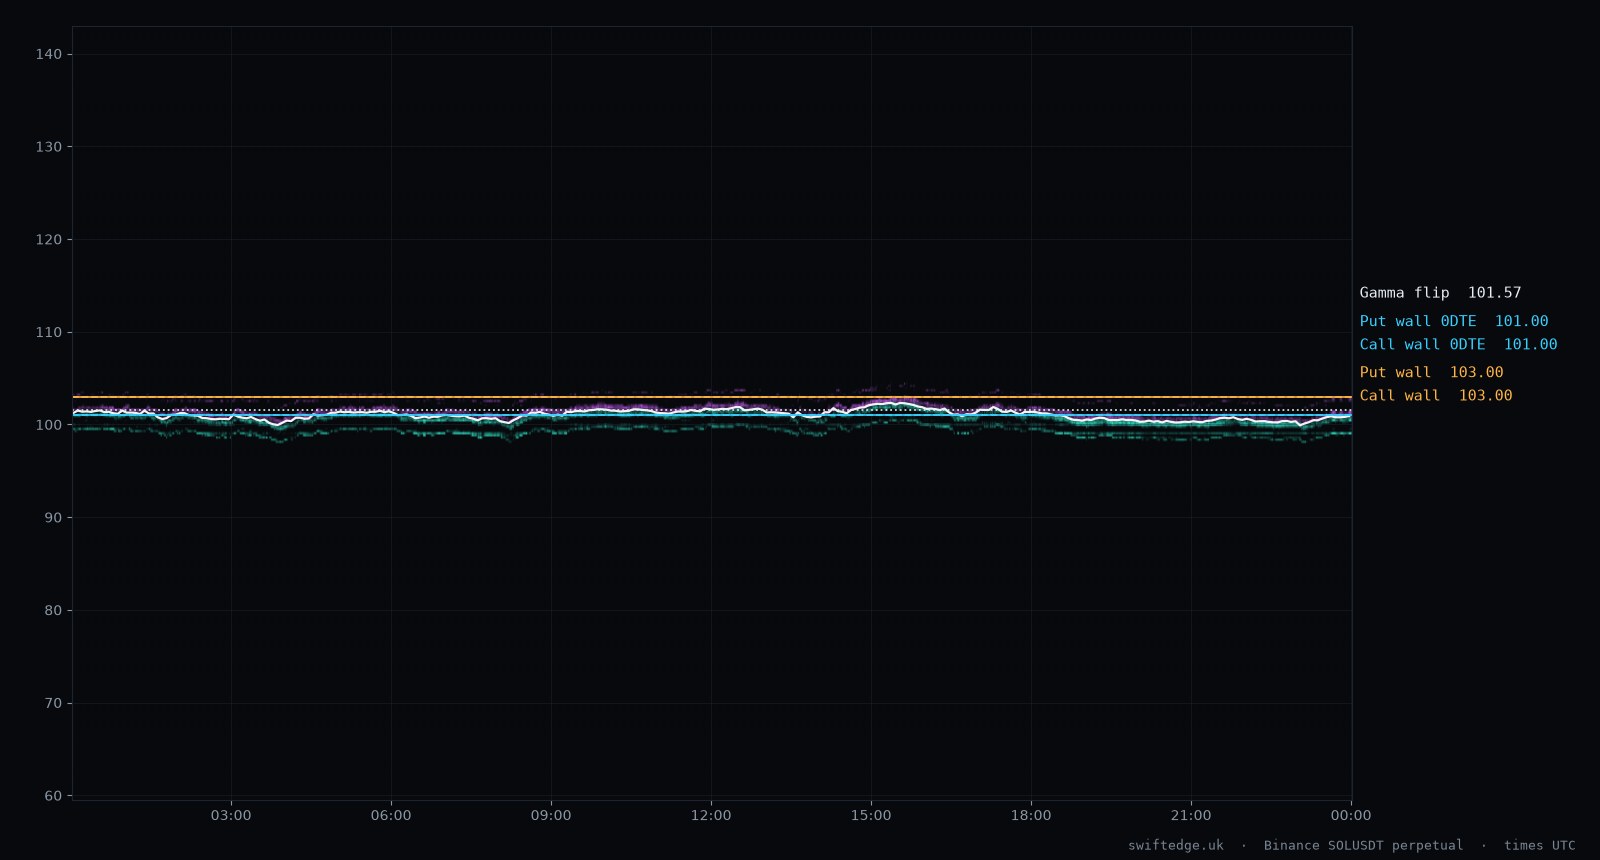
SOL order book heatmap for 26 Oct 2026 with price, options walls and the day's liquidity wall events
Asks (resting sell liquidity)Bids (resting buy liquidity) Call / put wall0DTE wallsGamma flip

What happened

Written from the data, not opinion.

Options positioning puts the call wall at 103.00 and the put wall at 103.00. Dealers are estimated to be short gamma, where dealer hedging tends to add to moves.

Liquidity wall events

Classified from every trade at the wall's own price, not from candles. What is a liquidity wall?

EventWallTime
No clean wall event today. A wall only counts when the trades at its own price prove what happened.

Options positioning

Deribit, OKX and Bybit open interest, end of day.

Estimated: dealers short gamma

Under the usual sign assumption, dealers sell into drops and buy into rallies to stay hedged, which can speed up moves.

Call wall
Strike with the most call gamma
103.00
Put wall
Strike with the most put gamma
103.00
Gamma flip
Where total dealer gamma changes sign
101.57 from 102.10
Call wall 0DTE
Expiring within 24 hours
101.00 from 102.00
Put wall 0DTE
Expiring within 24 hours
101.00 from 100.00

Resting liquidity at the close

Largest walls within 2.5 % of price.

Largest bids below

  • 99.0042,009 SOL
  • 99.3021,728 SOL
  • 99.5521,699 SOL

Largest asks above

  • 101.3026,737 SOL
  • 102.0020,540 SOL
  • 101.0519,074 SOL

Next options expiries

Bar = open interest; monthly and quarterly in orange.

Tue 27 Octdaily
42,049 SOL · 3.9 %
Fri 30 Octmonthly
439,973 SOL · 40.5 %
Fri 27 Novmonthly
121,713 SOL · 11.2 %
Fri 25 Decquarterly
443,640 SOL · 40.8 %

See every wall form and disappear, live.The same data as this report, second by second, free in your browser.

Open Depth
← 25 Oct27 Oct →

Also in Português · Español

Method. Price, volume and order book from Binance USDⓈ-M SOLUSDT. Option levels use open interest from Deribit, OKX and Bybit with the common assumption that dealers are long calls and short puts; it is an estimate, not measured positioning. A wall is "held" when trades hit it and price turned, "pulled" when it vanished within seconds with almost nothing traded, "eaten" when most of it was traded away. Times are UTC. Updated 27 Oct 00:05 UTC.