Daily market structure BTCUSDT perpetualFinal

Bitcoin on Saturday, 17 October 2026

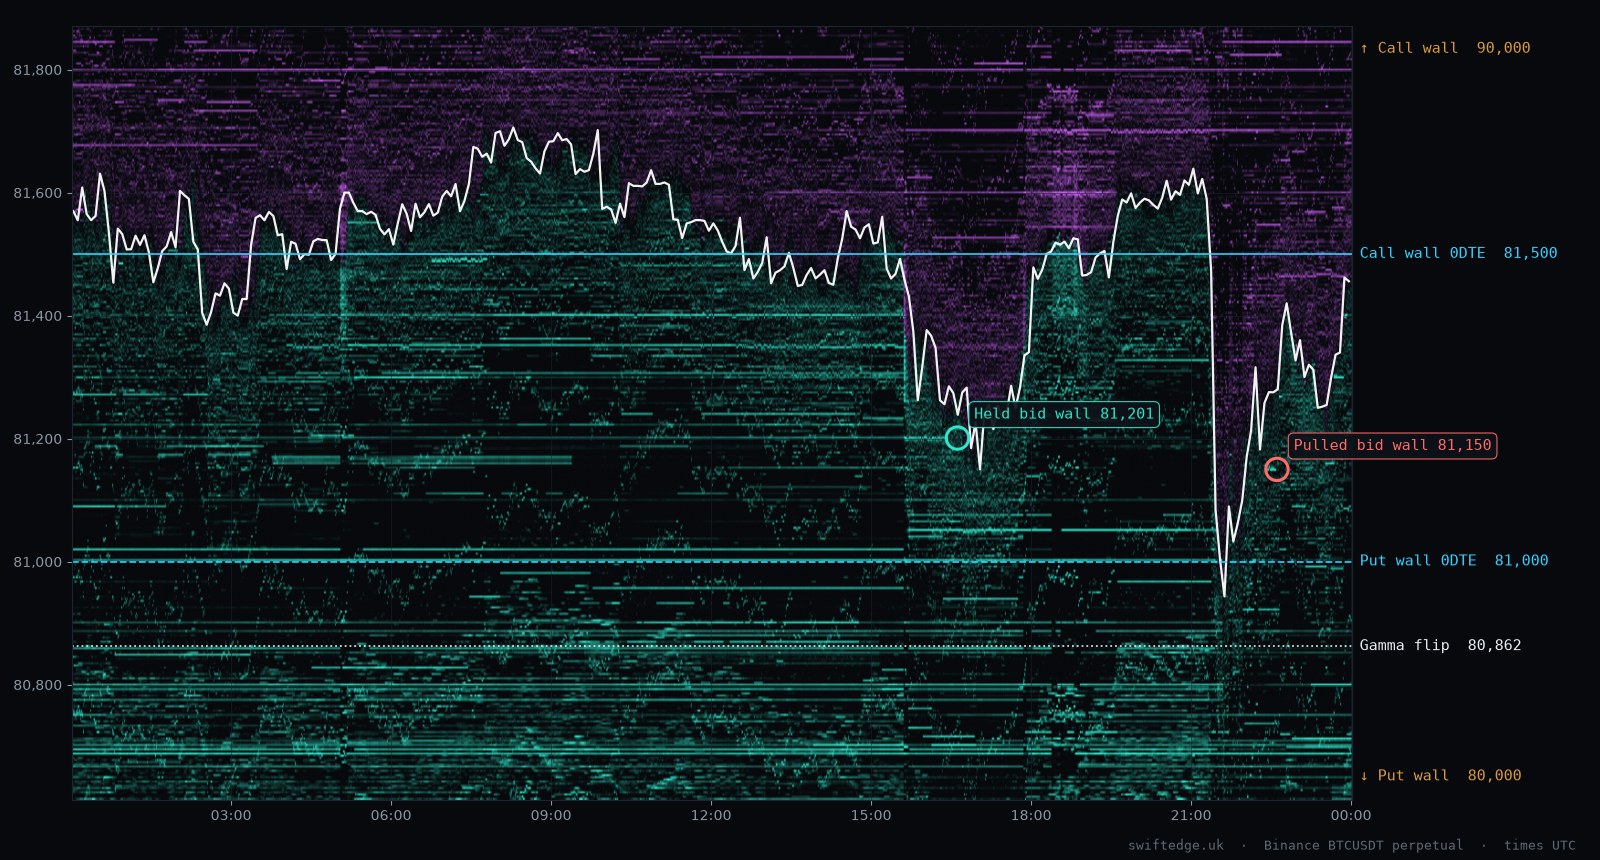
BTC closed down 0.15 % on the day, trading between 80,751 and 81,733. The high came at 07:30 UTC and the low at 21:35 UTC.

Close
81,456
−0.15 % from 81,578 open
Range
982
80,751 – 81,733
Dealer regime
Long gamma
Hedging dampens moves
Volume
44,806
BTC traded

Sessions

Asia, London and New York, each summed up when it closes. Times follow local opening hours.

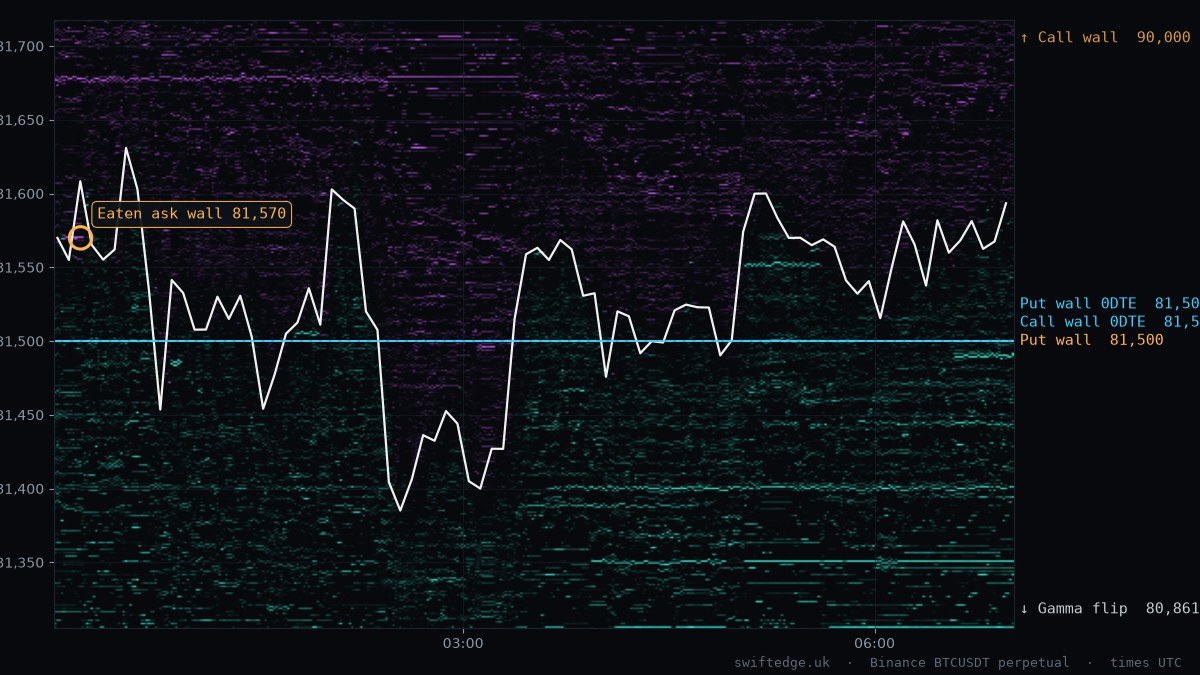
Asia
00:00–07:00 UTC
Closed
+0.02 %
81,373 – 81,650  ·  range 276
high 00:35 UTC  ·  low 02:35 UTC  ·  8,467 BTC
  • EatenAsk wall 81,570 at 00:12
Long gamma  ·  CW 90,000  ·  PW 81,500
BTC order book heatmap, Asia session, 17 Oct 2026
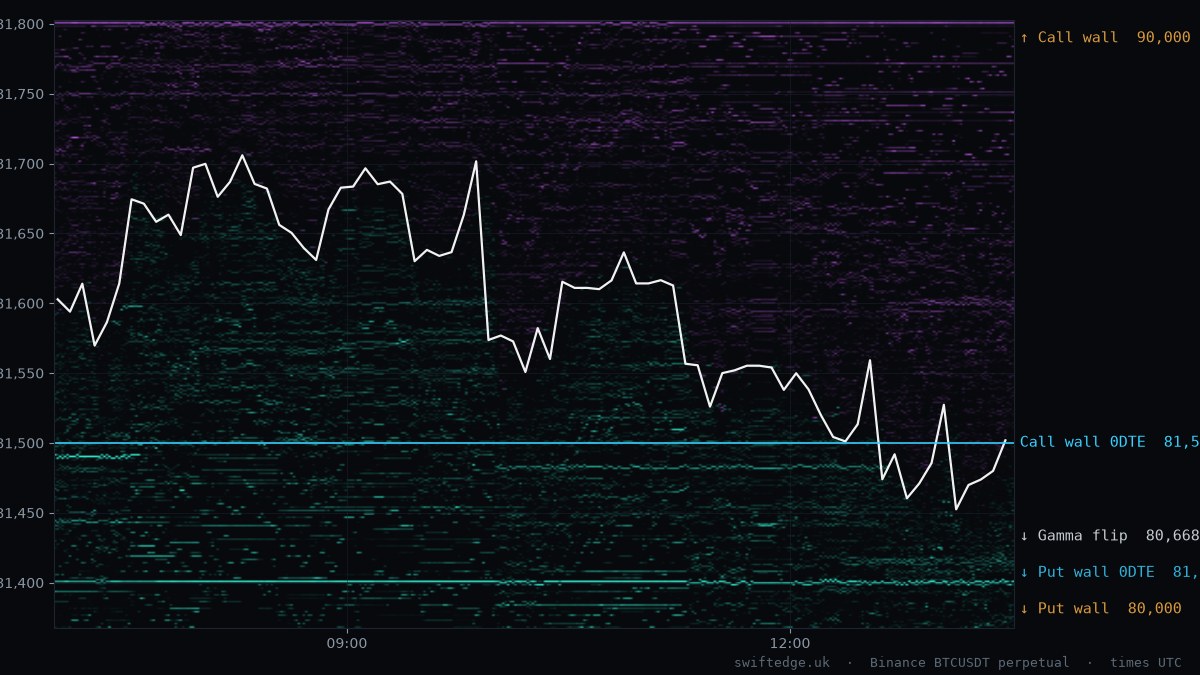
London
07:00–13:30 UTC
Closed
−0.11 %
81,437 – 81,733  ·  range 296
high 07:30 UTC  ·  low 13:15 UTC  ·  8,480 BTC
  • PulledBid wall 81,348 at 13:05
Long gamma  ·  CW 90,000  ·  PW 80,000
BTC order book heatmap, London session, 17 Oct 2026
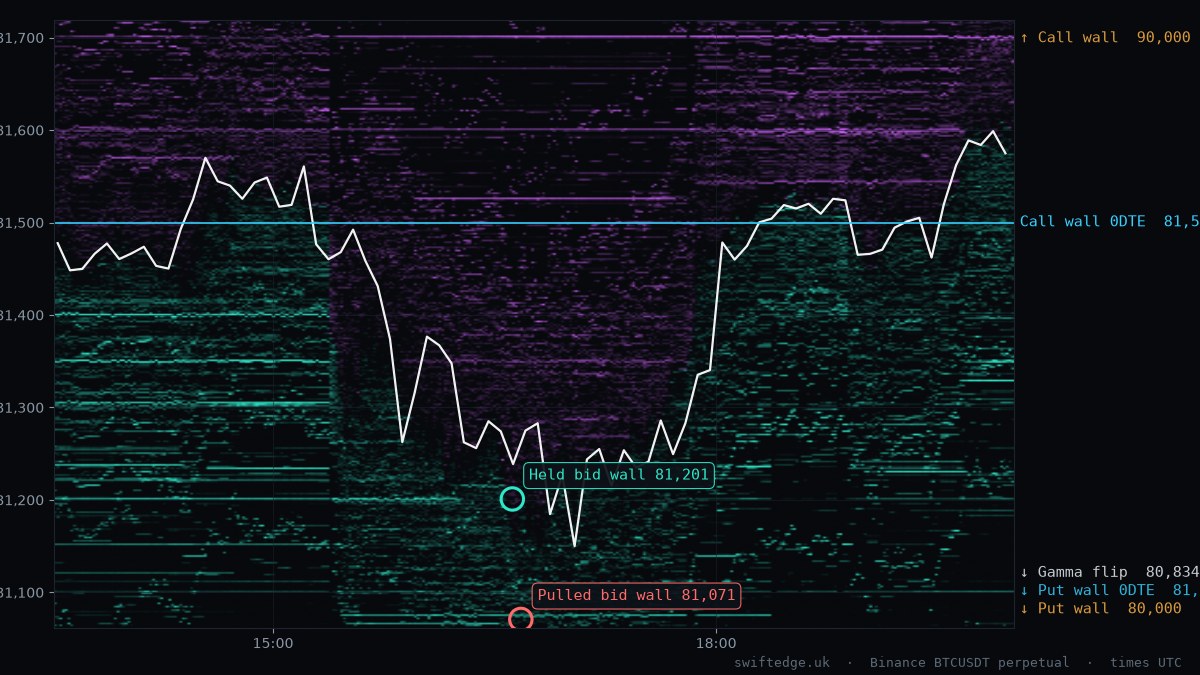
New York
13:30–20:00 UTC
Closed
+0.09 %
81,150 – 81,631  ·  range 481
high 19:45 UTC  ·  low 17:05 UTC  ·  12,285 BTC
  • HeldBid wall 81,201 at 16:37
  • PulledBid wall 81,071 at 16:40
Long gamma  ·  CW 90,000  ·  PW 80,000
BTC order book heatmap, New York session, 17 Oct 2026
BTC order book heatmap for 17 Oct 2026 with price, options walls and the day's liquidity wall events
Asks (resting sell liquidity)Bids (resting buy liquidity) Call / put wall0DTE wallsGamma flip

What happened

Written from the data, not opinion.

Options positioning puts the call wall at 90,000 and the put wall at 80,000. Dealers are estimated to be long gamma, where dealer hedging tends to dampen moves.

The bid wall at 81,201 held at 16:37 UTC: about 77 BTC traded into it and price turned 62 USD away.

At 22:36 UTC a 128 BTC bid wall at 81,150 was pulled before price reached it.

Liquidity wall events

Classified from every trade at the wall's own price, not from candles. What is a liquidity wall?

EventWallTime
HeldBid wall 81,201
77 BTC traded into it, price turned 62 USD
16:37 UTC
PulledBid wall 81,150
128 BTC wall, 113 BTC removed in 0.2 s, almost nothing traded
22:36 UTC

Options positioning

Deribit, OKX and Bybit open interest, end of day.

Estimated: dealers long gamma

Under the usual sign assumption, dealers buy dips and sell rallies to stay hedged, which tends to calm the market around big strikes.

Call wall
Strike with the most call gamma
90,000
Put wall
Strike with the most put gamma
80,000
Gamma flip
Where total dealer gamma changes sign
80,862 from 80,862
Call wall 0DTE
Expiring within 24 hours
81,500
Put wall 0DTE
Expiring within 24 hours
81,000 from 81,500

Resting liquidity at the close

Largest walls within 2.5 % of price.

Largest bids below

  • 79,850444 BTC
  • 80,000282 BTC
  • 80,500281 BTC

Largest asks above

  • 82,500196 BTC
  • 82,225138 BTC
  • 82,300131 BTC

Next expiries

Share of all open BTC options.

18-OCT8,299 BTC1.9 %
23-OCT18,972 BTC4.3 %
30-OCT162,978 BTC36.7 %
27-NOV30,474 BTC6.9 %

See every wall form and disappear, live.The same data as this report, second by second, free in your browser.

Open Depth
← 16 Oct18 Oct →

Method. Price, volume and order book from Binance USDⓈ-M BTCUSDT. Option levels use open interest from Deribit, OKX and Bybit with the common assumption that dealers are long calls and short puts; it is an estimate, not measured positioning. A wall is "held" when trades hit it and price turned, "pulled" when it vanished within seconds with almost nothing traded, "eaten" when most of it was traded away. Times are UTC. Updated 18 Oct 00:05 UTC.