Daily market structure BTCUSDT perpetualFinal

Bitcoin on Friday, 16 October 2026

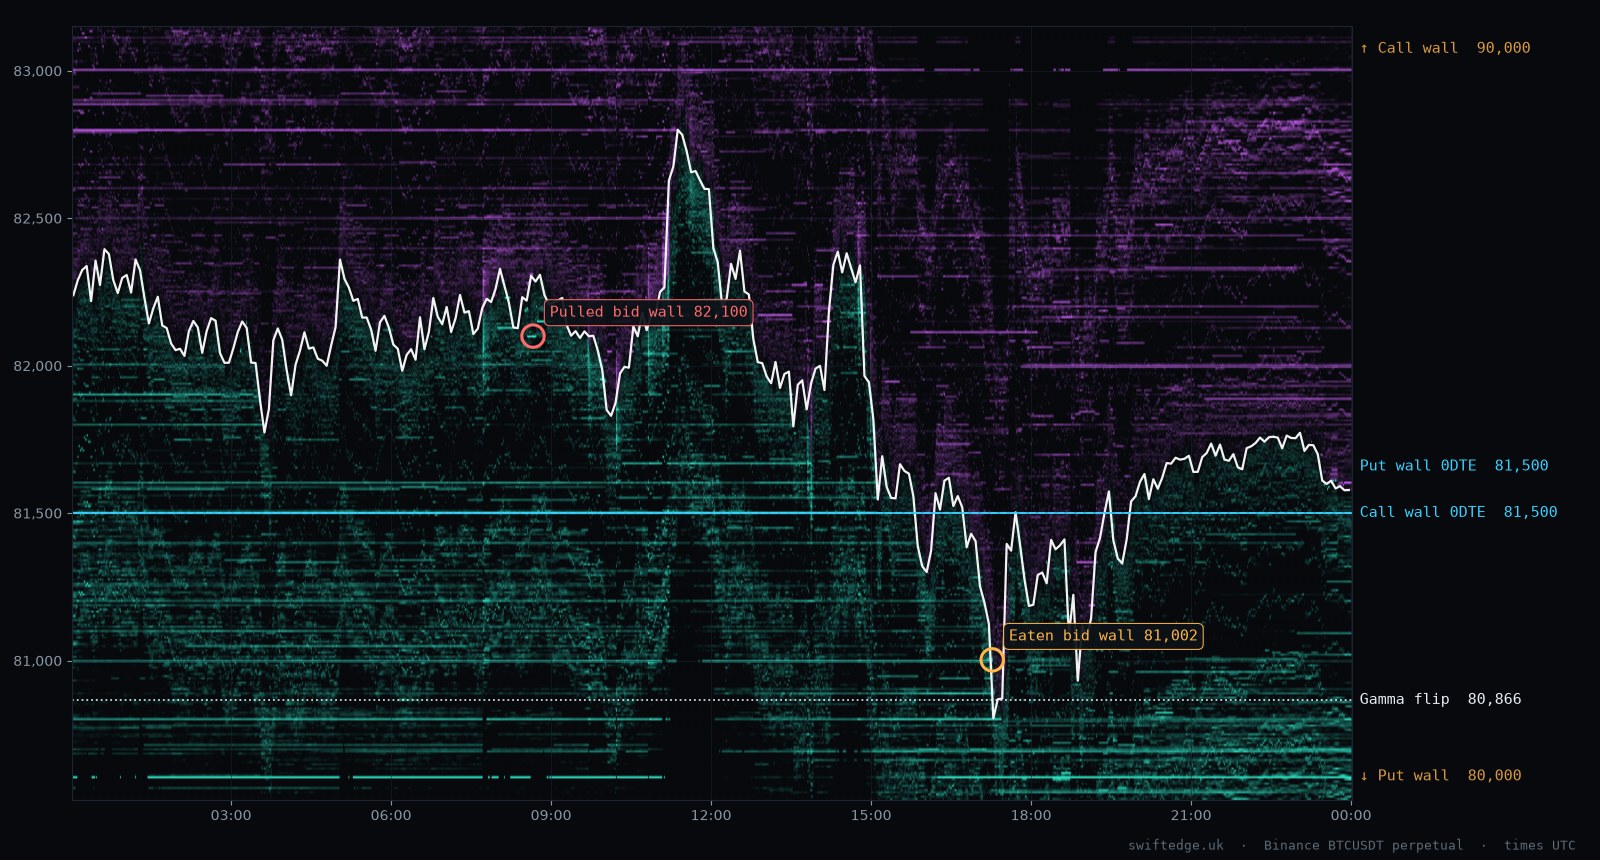
BTC closed down 0.75 % on the day, trading between 80,780 and 82,900. The high came at 11:25 UTC and the low at 17:25 UTC.

Close
81,578
−0.75 % from 82,195 open
Range
2,120
80,780 – 82,900
Dealer regime
Long gamma
Hedging dampens moves
Volume
139,044
BTC traded

Sessions

Asia, London and New York, each summed up when it closes. Times follow local opening hours.

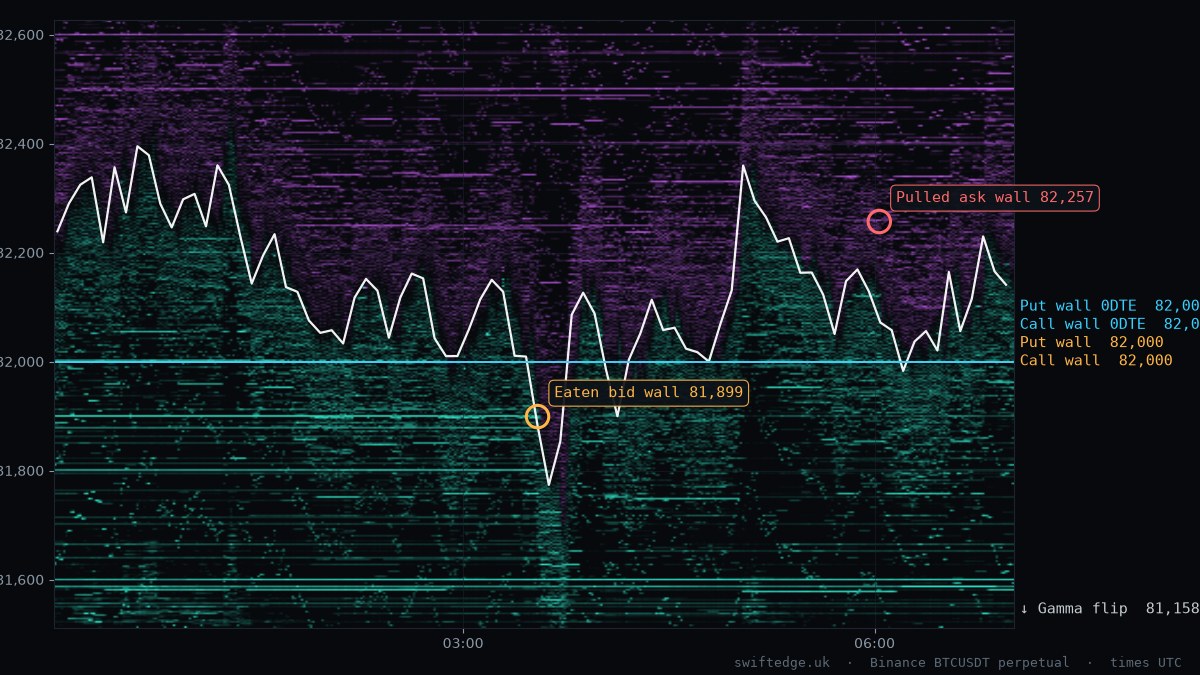
Asia
00:00–07:00 UTC
Closed
−0.07 %
81,638 – 82,500  ·  range 862
high 01:15 UTC  ·  low 03:40 UTC  ·  23,954 BTC
  • EatenBid wall 81,899 at 03:32
  • PulledAsk wall 82,257 at 06:02
Long gamma  ·  CW 82,000  ·  PW 82,000
BTC order book heatmap, Asia session, 16 Oct 2026
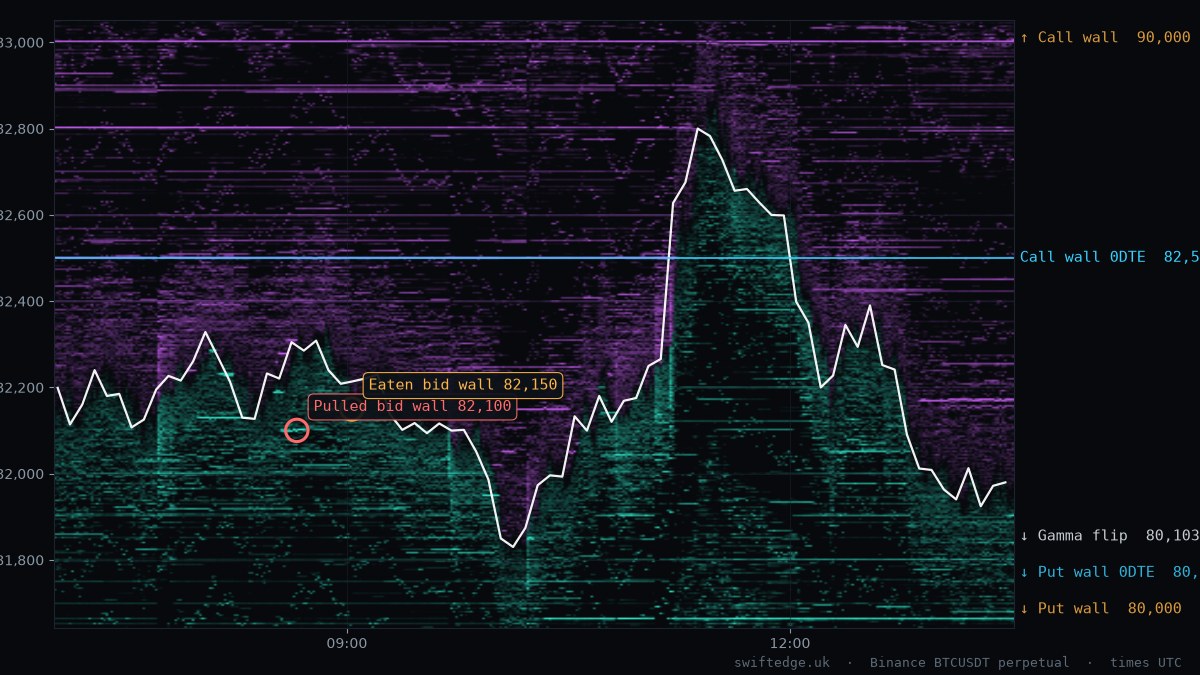
London
07:00–13:30 UTC
Closed
−0.20 %
81,794 – 82,900  ·  range 1,107
high 11:25 UTC  ·  low 10:05 UTC  ·  33,973 BTC
  • PulledBid wall 82,100 at 08:39
  • EatenBid wall 82,150 at 09:01
Long gamma  ·  CW 90,000  ·  PW 80,000
BTC order book heatmap, London session, 16 Oct 2026
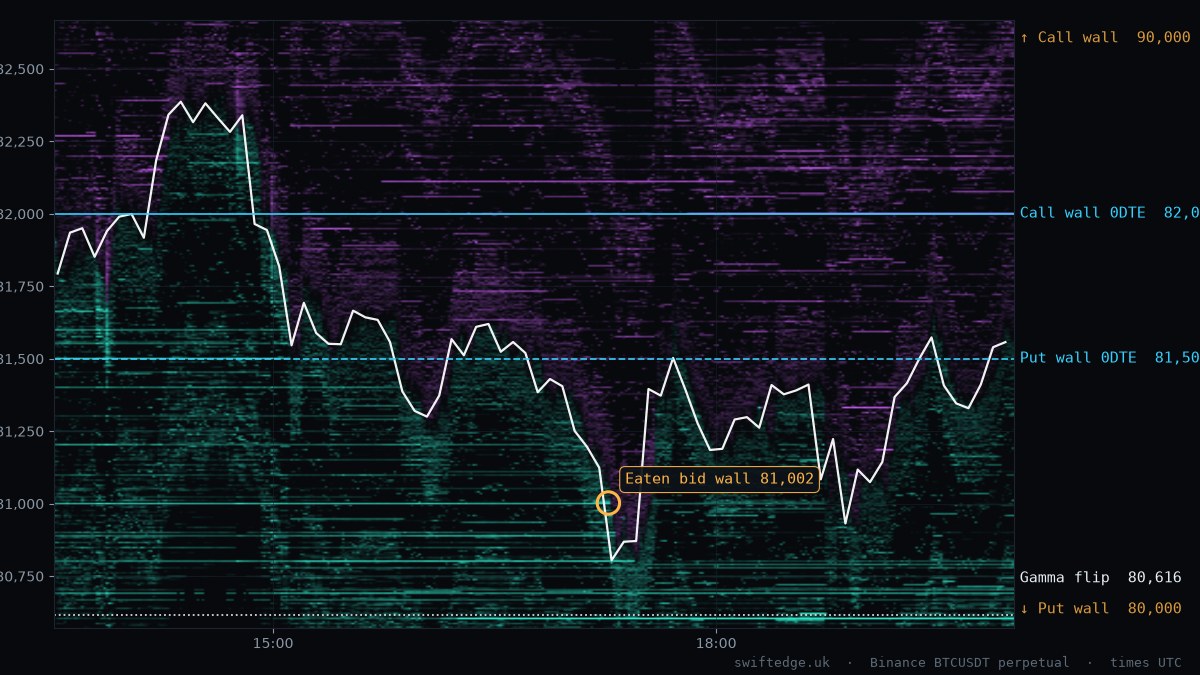
New York
13:30–20:00 UTC
Closed
−0.52 %
80,780 – 82,460  ·  range 1,680
high 14:20 UTC  ·  low 17:25 UTC  ·  70,951 BTC
  • EatenBid wall 81,002 at 17:16
Long gamma  ·  CW 90,000  ·  PW 80,000
BTC order book heatmap, New York session, 16 Oct 2026
BTC order book heatmap for 16 Oct 2026 with price, options walls and the day's liquidity wall events
Asks (resting sell liquidity)Bids (resting buy liquidity) Call / put wall0DTE wallsGamma flip

What happened

Written from the data, not opinion.

Options positioning puts the call wall at 90,000 and the put wall at 80,000. Dealers are estimated to be long gamma, where dealer hedging tends to dampen moves.

At 08:39 UTC a 110 BTC bid wall at 82,100 was pulled before price reached it.

At 17:16 UTC a 202 BTC bid wall at 81,002 was eaten by market orders.

Liquidity wall events

Classified from every trade at the wall's own price, not from candles. What is a liquidity wall?

EventWallTime
PulledBid wall 82,100
110 BTC wall, 110 BTC removed in 69.5 s, almost nothing traded
08:39 UTC
EatenBid wall 81,002
221 BTC of 202 BTC traded away
17:16 UTC

Options positioning

Deribit, OKX and Bybit open interest, end of day.

Estimated: dealers long gamma

Under the usual sign assumption, dealers buy dips and sell rallies to stay hedged, which tends to calm the market around big strikes.

Call wall
Strike with the most call gamma
90,000
Put wall
Strike with the most put gamma
80,000
Gamma flip
Where total dealer gamma changes sign
80,866 from 80,996
Call wall 0DTE
Expiring within 24 hours
81,500 from 82,000
Put wall 0DTE
Expiring within 24 hours
81,500 from 83,000

Resting liquidity at the close

Largest walls within 2.5 % of price.

Largest bids below

  • 80,200298 BTC
  • 80,600270 BTC
  • 80,700212 BTC

Largest asks above

  • 81,600258 BTC
  • 82,650193 BTC
  • 82,675154 BTC

Next expiries

Share of all open BTC options.

17-OCT10,171 BTC2.3 %
23-OCT18,711 BTC4.2 %
30-OCT162,929 BTC36.3 %
27-NOV30,419 BTC6.8 %

See every wall form and disappear, live.The same data as this report, second by second, free in your browser.

Open Depth
← 15 Oct17 Oct →

Method. Price, volume and order book from Binance USDⓈ-M BTCUSDT. Option levels use open interest from Deribit, OKX and Bybit with the common assumption that dealers are long calls and short puts; it is an estimate, not measured positioning. A wall is "held" when trades hit it and price turned, "pulled" when it vanished within seconds with almost nothing traded, "eaten" when most of it was traded away. Times are UTC. Updated 17 Oct 00:05 UTC.