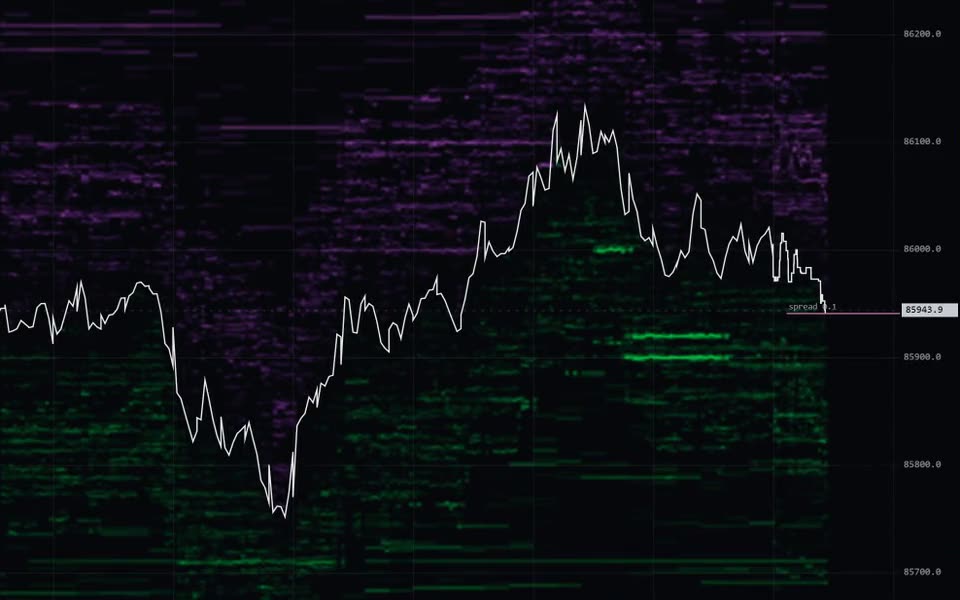
Swiftedge Depth shows the live gold futures order book (XAUUSDT perpetual, Binance USDⓈ-M; BTCUSDT at /depth, ETHUSDT at /eth/depth, SOLUSDT at /sol/depth) as a heatmap, with every trade drawn as a bubble sized by volume and price as a line,
candlesticks or a footprint chart. It adds a new column four times a second, keeps at least the last 24
hours of history (older hours load as you scroll back) and runs free in your browser with no sign-up. Made by Swiftedge.
What you are looking at
Heatmap: resting limit orders by price and time. Green below price are bids, violet above are asks;
brighter means more size.
Bubbles: executed trades. Teal for aggressive buys, violet for aggressive sells; the size is the volume.
Price: a white line, candlesticks (1 second to 4 hours) or a footprint chart, chosen with the three icons
in the top bar. The footprint shows volume sold into the bid and bought from the ask at every price in each candle,
with diagonal imbalances, the point of control (yellow box) and a volume, delta and delta % table that can be
minimized or resized.
Lines and panes: the day's VWAP in yellow, traded volume underneath with CVD since 00:00 UTC (the
CVD button in the pane's corner; drag the pane's top edge to resize it or minimize it with ▾) and a
depth profile of the current book beside the price axis.
Side panel: Mentor analysis, Session Orbs, GEX options levels, 5-minute flow, buy vs sell and news.
How to use it
Mouse: the wheel zooms time, shift + wheel zooms price, drag pans, double-click returns to live.
Touch: drag to scroll, pinch to zoom time or price, double-tap to return to live, press and hold to inspect a
bubble or level. On a phone the bar at the bottom holds Indicators, Draw, Alerts, Share, Chat and More.
Line, candles, footprint and the timeframe (auto, 1m, 5m, 15m, 1h, more under ▾) sit in the top bar.
Links can open a view directly, for example /gold/depth?chart=footprint&tf=1m.
today shows the whole day; AUTO-SCROLL follows the live edge and AUTO-SCALE refits the price axis.
indicators or + add indicator opens the catalogue: Liquidity, Bubbles, Executions, VWAP with
standard-deviation bands for the day, week and month, volume profiles per day, session, week or the visible range
(POC, value area and naked POCs), a TPO profile, 20 classic indicators (moving averages, Bollinger, Keltner, Ichimoku,
SuperTrend, RSI, MACD, Stochastic, ADX and more), CVD divergence, Mentor, Session Orbs, GEX, Liquidations (real
forced closes from Binance, OKX and Bybit), Stacked imbalance zones and the Imbalance readout
(every indicator explained). The toolbar on the left has 26 drawing tools, including
Anchored VWAP and a range volume profile, saved in your own browser.
Alerts sets price and large-wall alerts with sound and browser notifications while the tab is open;
Swiftedge Alerts also reach you with the tab closed, by browser push, Telegram or a webhook.
Share turns the moment under the pointer (or now) into an image card with a link. Chat is one live room
shared with Options and the Terminal.
Quick answers
Is the footprint's buy and sell split real?
Yes. Every trade from Binance carries the aggressor side; Depth
adds it to the bid or ask column of its price row. About 48 hours of footprint and candle history are available.
Is it free?
Yes, with no account. Everything on Swiftedge is free; it is paid for by ads and voluntary support.
Where does the data come from?
Order book and trades from Binance USDⓈ-M futures; options data for
GEX from GLD/IAU ETF options (proxy, 15 min delayed, US market hours), strikes converted to the gold price, one snapshot
per minute.
What is GEX?
Estimated options gamma exposure, with the gamma flip, call wall and put wall drawn on the
chart. The dealer positioning behind it is an assumption, not a measurement.
Is this spot gold?
No. XAUUSDT is a perpetual futures contract on Binance (1 contract = 1 troy ounce)
that trades 24/7. Spot gold has no public order book and closes at the weekend, in the daily break from 17:00 to 18:00
New York time and on US holidays; then a note above the chart says the market is closed.
The order book and trades you see are the contract's own.
Is it financial advice?
No. Depth shows market data and descriptive analysis for information and
education. Trading involves substantial risk of loss.
aggregation merges trades within the window at the same price level
execution lasers
liquidity heatmap
gamma above 1 darkens the ordinary and lets only the walls glow · the floor
hides everything below its share of the reference — it is the strongest control if
you want to see less · "deep book" controls the band from
0.22 % to 2 % out, which is coarsely resolved — set it to 0 for the near book only
without this, green glows 55–60 % brighter than violet at the same size, so
the sides cannot be compared by eye
reset
mouse
wheel = zoom time shift + wheel = zoom price drag = pan
double-click = auto scroll + scale esc = back to cursor
drawing
drag, or click point by point shift = horizontal small triangle = more tools (or right-click)
Alt+H/J/V/C = horizontal/ray/vertical/cross at the mouse Alt+T trend · Alt+F fib · Alt+Shift+R rectangle
Delete = delete · Ctrl+Z / Ctrl+Y = undo / redo double-click text = edit
panel
Mentor
loading analysis…
A descriptive seven-step analysis of Binance futures and the order book. Not a proven signal and not financial advice.
Session Orbs
loading…
Opening range = the first minutes of the session. RVR = OR volume against the same session's average. IVB = OR ± k × the VWAP deviation before the open; k follows implied volatility. The percentages at the targets are historical (same session, 60 days) and descriptive.
GEX (options)
loading…
Gamma exposure (options) from BTC options on Deribit, OKX and Bybit, one snapshot per minute. GEX = gamma × open interest × price² × 1 %, in USD. The sign is an ASSUMPTION: dealers long calls / short puts — actual dealer positioning is not known. 0DTE = expiry within 24 h (cyan +, magenta −), carry = later expiries (amber +, violet −). Flip = where total GEX changes sign; CW/PW = the strike with the largest call/put gamma. Descriptive, not a measured signal and not financial advice. "sign model: flow" = the Deribit dealer position from trade flow (taker = customer, maker = dealer; clipped to open interest); OKX/Bybit stay on the assumption. Faint columns before the dashed marker are reconstructed (today's OI, DVOL-scaled IV), not measured.
5m flow
Aggressive volume in the running 5-minute window, reset every five minutes. Cyan lifted the ask, violet hit the bid.
Buy vs sell
The share of volume that lifted the ask, per timeframe. Binance marks which side crossed the spread — not who wanted it more.